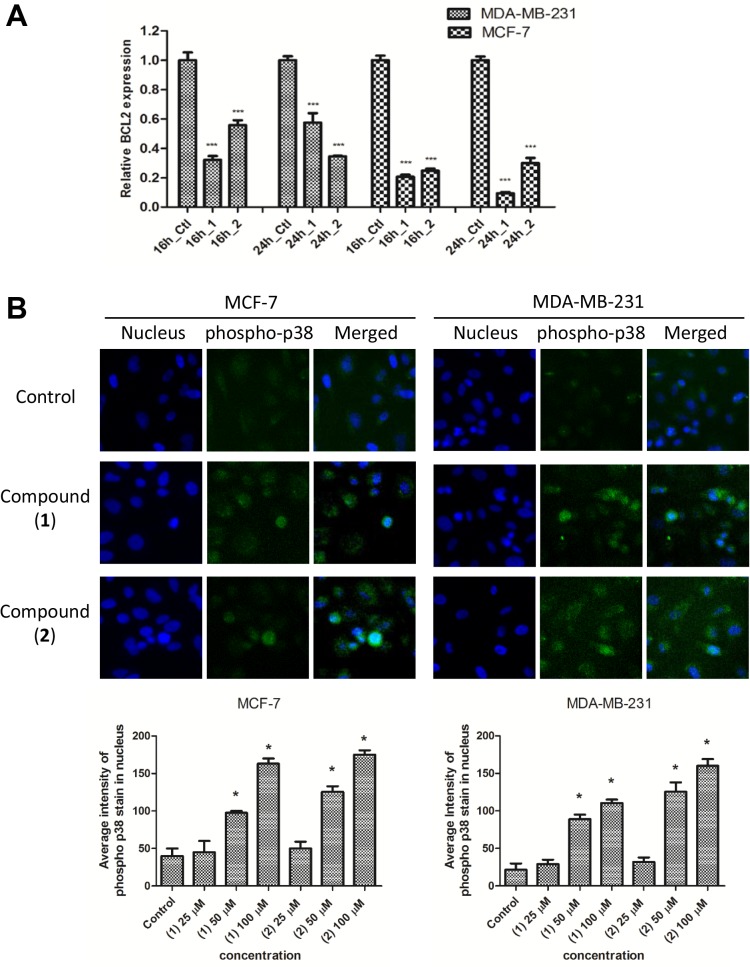
Fig 7. (1) and (2) modulate BCL2 and p38 MAPK signaling pathway.
(A) QPCR analysis of BCL2 expression in MCF-7 and MDA-MB-231 cells treated with IC50 concentration of (1) or (2) for 16 h or 24 h. The bars represent mean +/- SD and the control, untreated cells values were normalized to 1. GAPDH served as an internal control for normalization. Data were representative of at least three independent experiments. ***P<0.01, in comparison to control. (B) Representative figure showing nuclear accumulation of phospho p38 MAPK (green) in the nucleus (blue) of MCF-7 or MDA-MB-231 cells treated with (1) or (2) for 24 h. The fluorescent intensity of phospho p38 MAPK in the nucleus was quantitated and presented in bar charts. *P<0.05, in comparison to control.

