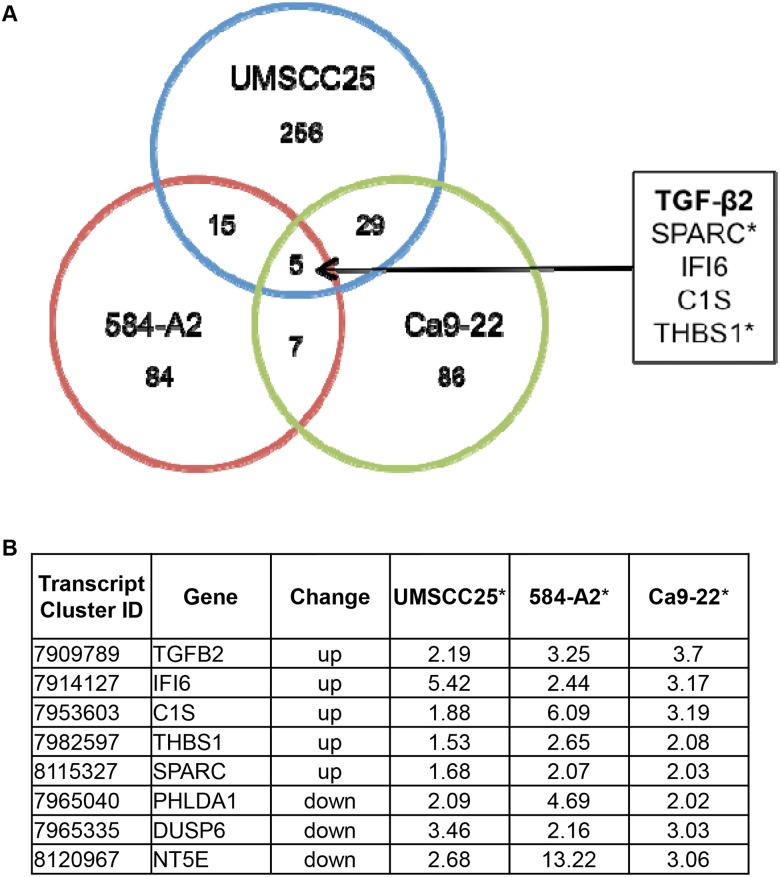
Fig 1. Comparison of genes upregulated after AZD8010 and Gefitinib treatment.
RNA and protein was isolated from UMSCC25, 584-A2, and Ca9-22 HNSCC cell lines that were treated for 4 days with DMSO (control), 0.3M AZD8010, 0.1M gefitinib, or both AZD8010 and gefitinib. RNA was submitted to an Affymetrix GeneChip analysis and revealed 5 genes that were upregulated in common with AZD8010 and gefitinib. The genes identified had either a >2 (UMSCC25 and Ca9-22) or >1.5 (584-A2) fold change in expression levels compared to the DMSO control. A. A venn diagram showing the genes upregulated in all the cell lines. B. Tabulated values for the genes increased and decreased in the AZD8010 and gefitinib treated group. *Numbers are the fold change in the treated compared to the control. TKIs: AZD8010 is an FGF receptor inhibitor and gefitinib is an EGF receptor inhibitor.

