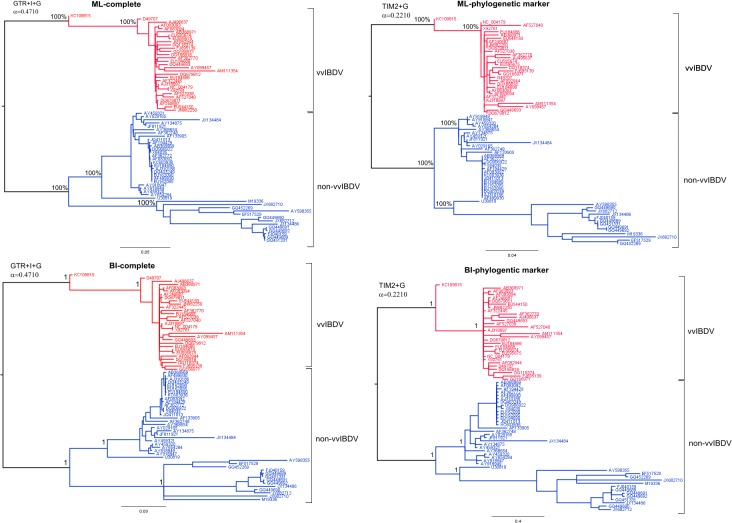
Fig 2. Topology comparison for IBDV.
Topologies obtained from complete segment B (complete) and B-marker (phylogenetic marker) by Bayesian Inference (BI) and maximum likelihood (ML) analyses are shown. The model used to generate each tree is shown at the top left. Each main lineage is denoted (red for vvIBDV lineage and blue for non-vvIBDV lineage). Numbers along the branches refer to the bootstrap percentages and posterior probability values in the ML and BI analyses, respectively.

