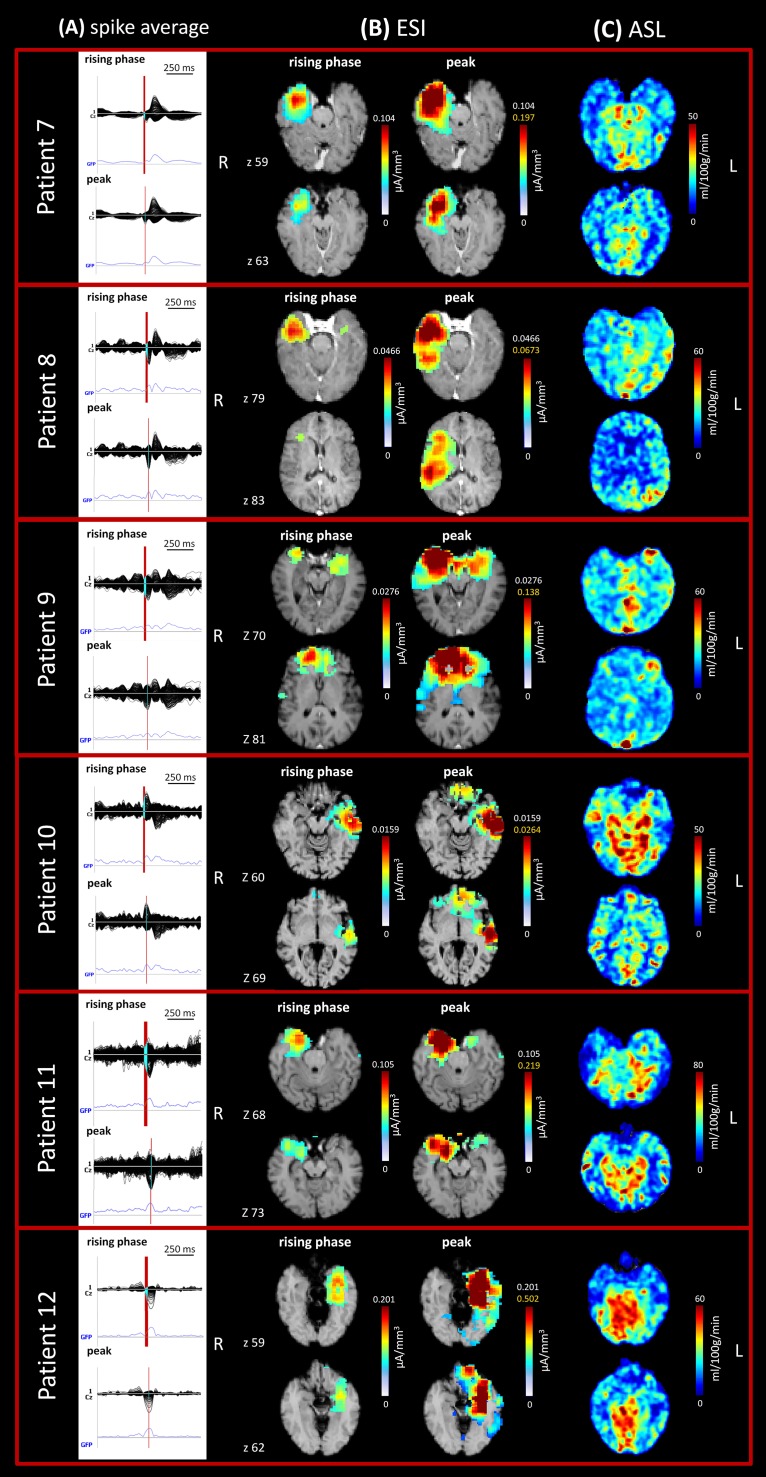
Fig 2. Imaging analysis results in the six patients (patients nos. 7–12) with focal epilepsy.
ESI and ASL images of the same anatomical space were acquired for each patient and two axial sections are shown (z coordinates in native space). (A) Spike average: 256-channel EEG traces with a duration of 1 s (spike average). The global field power is used for the onset (red line). (B) ESI results: EEG source imaging at 50% rising phase of the peak (up) and at the peak (down). The scale indicates the current density (CD) [μA/mm3]. (C) ASL results. The scale indicates the cerebral blood flow (CBF) values [ml/100g/min].

