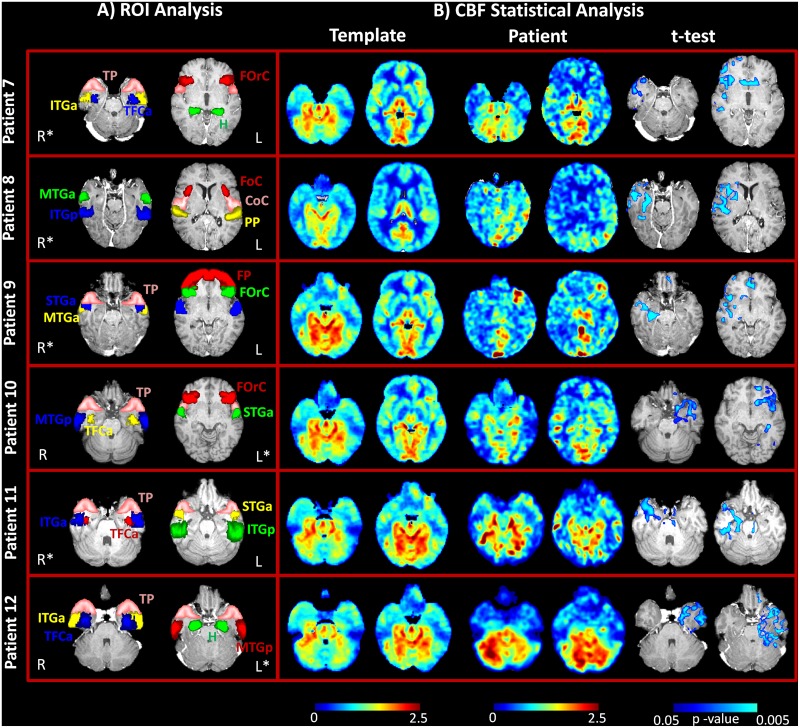
Fig 3. ASL imaging results in the new group of six patients (patients nos. 7–12) with focal epilepsy.
A) Regions of interest (ROIs) for the quantification of current density (CD) and cerebral blood flow (CBF) values at the same anatomical level in each subject. ROIs are superimposed over axial T1-weighted slices in MNI space. B) Statistical analysis results from the template-based comparison. CBF maps (normalized values) for the same axial slices reported in part A) are shown here for the control group (template) and patients, together with the statistical map. In all patients, only areas with a statistically significant decrease in perfusion as compared to the healthy subjects were detected (blue scale, FDR corrected, q < 0.05).

