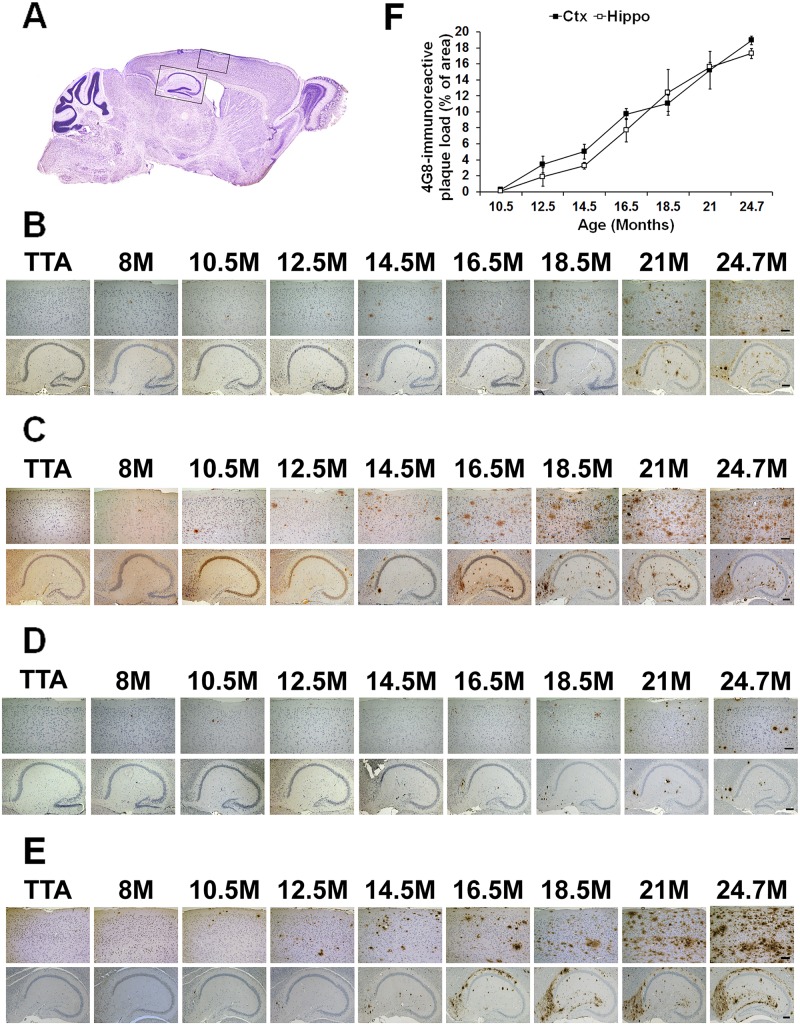
Fig 4. Age-related Aβ plaque progression in rTg9191 mice.
(A) A representative sagittal section of brain. Black rectangles indicate the regions of cerebral cortex and hippocampal formation in which Aβ plaques are shown in (B-E). (B-E) Representative photomicrographs showing age-dependent progression of Aβ plaques in female mice, visualized using 6E10 (B); 4G8, directed against a mid-region of Aβ (C); 139–5, an Aβx-40-specific antibody (D); and 1-11-3, an Aβx-42-specific antibody (E). Upper panels, cerebral cortex; lower panels, hippocampus. Scale bars: 100 μm (upper panels), 200 μm (lower panels). TTA, mice expressing only the tetracycline transactivator. (F) Quantification of 4G8-immunoreactive Aβ plaque load at various ages.

