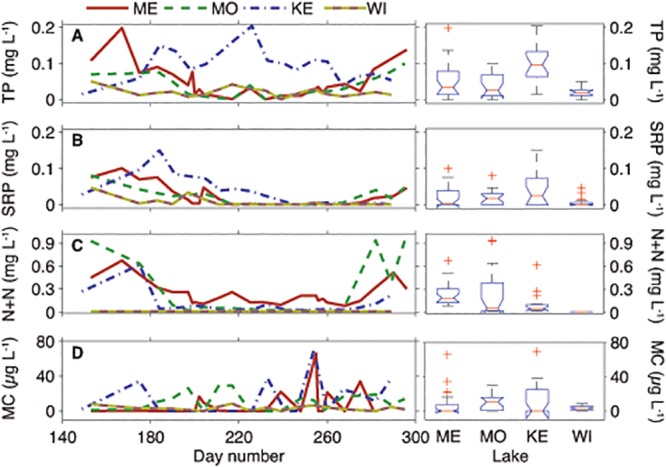
Fig 3. Time-series comparison of total phosphorus (TP), soluble reactive phosphorus (SRP), nitrate plus nitrite (N + N) and total microcystin (Total MC), as well as boxplot results of one-way analysis of variance (ANOVA) of variables between the lakes.

Lakes are in order from largest to smallest; left to right: ME = Mendota, MO = Monona, KE = Kegonsa, and WI = Wingra.
