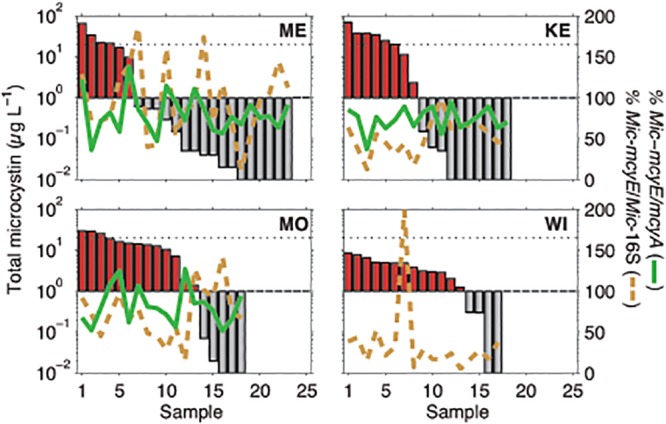
Fig 4. Comparison of percent Microcystis-mcyE/mcyA and percent Microcystis-mcy/Microcystis-16S versus the concentration of total microcystin observed (bars).

For correlation coefficients, refer to the text or S2–S5 Tables. The black dashed line is the World Health Organization (WHO) level for safe drinking water (1 μg L-1), while the dotted line is the WHO level for moderate recreational risk (40 μg L-1). Note that Lake Wingra had the most detects above 1 μg L-1, despite having the lowest concentrations of Total MC and percent toxic Microcystis observed.
