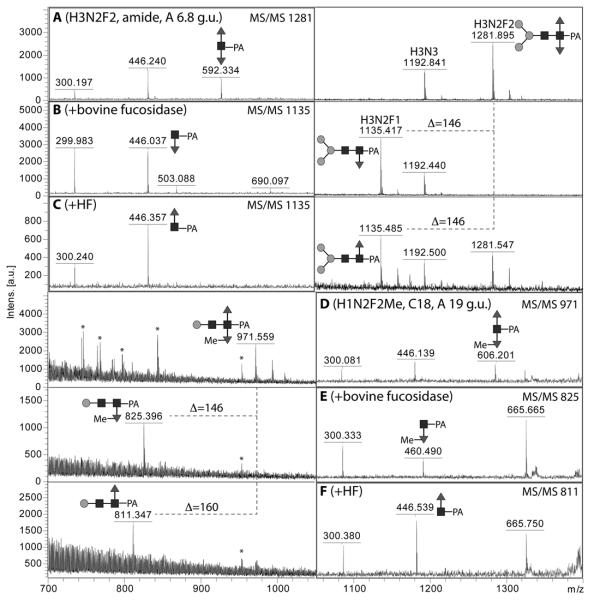
Figure 5. Chemical and enzymatic defucosylation of pyridylamino-labelled difucosylated N-glycans.
Selected fractions (either RP-amide or C18; A,D) of PNGase A release N-glycans were subject to either bovine α-fucosidase (B,E) or hydrofluoric acid treatment (C,F). Examples are shown here for Man3GlcNAc2Fuc2 and Man1GlcNAc2Fuc2Me1; the corresponding MS/MS spectra are shown on the left (A-C) or right (D-F) and are annotated to indicate the key fragments. Losses of fucose or methylfucose are indicated by the Δ values. Asterisks indicate non-glycan contaminants in the low-intensity 19 g.u. fraction.

