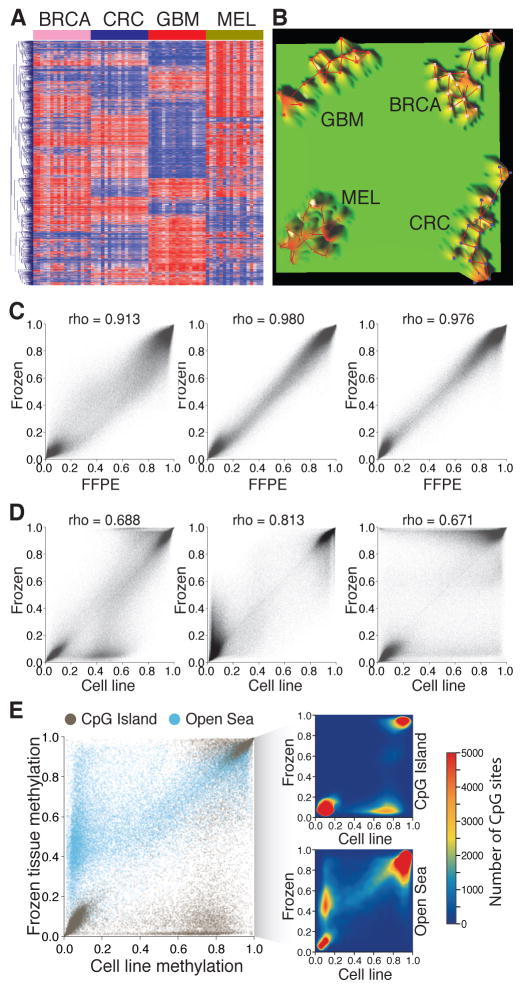
Figure 3. Strengths and weaknesses of DNA methylation as a cancer biomarker.
A–B: DNA methylation profiling can identify the tumor types. A- Heat map showing the unsupervised hierarchical cluster analysis using the DNA methylation level of the top 2,000 most variable CpG sites in four different cancer types: breast cancer (BRCA), colorectal cancer (CRC), glioblastoma (GBM), and melanoma (MEL). B- Terrain maps generated with the same DNA methylation signatures showing four separate conglomerates of samples representing the four different tumor types. C–E: Culture conditions induce genome-wide variations in DNA methylation level. C- Correlations between DNA methylation levels of three pairs of melanoma brain metastases stored as frozen and as formalin-fixed paraffin embedded tissues. D- Correlations between DNA methylation levels of the same three pairs of melanoma brain metastases stored frozen and established as cell cultures. E- Comparison of DNA methylation levels according to the CpG context of the assessed CpG sites. CpG sites located in CpG islands and in open sea regions are represented. The density plots represent the variations observed in CpG islands (upper) and open sea (lower).
CpG: Cytosine – guanine.

