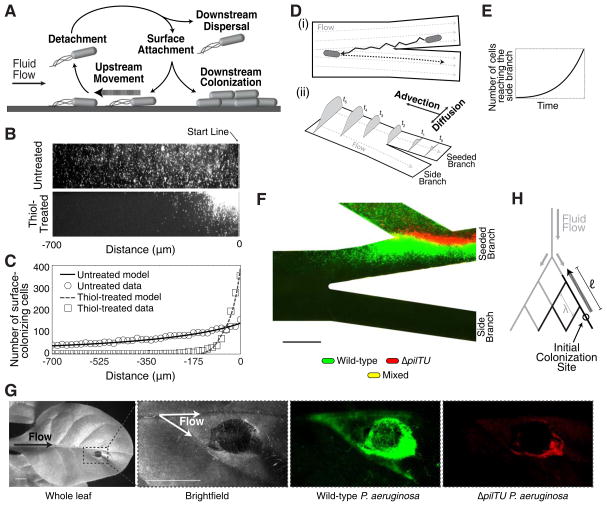
Figure 4. Theoretical and natural host models of upstream dispersal.
(A) Schematic illustrating the diverse motility modes observed during upstream dispersal. (B) Surface colonization of wild-type P. aeruginosa after 15 hours of flow in untreated and thiol-treated linear channels. (C) Corresponding population density data for untreated (circles) or thiol-treated (boxes) devices and population densities predicted by our upstream dispersal model (lines). (D) Schematic depicting the mechanism of upstream dispersal. (i) Cells move upstream in a zig-zag trajectory on surfaces, enter side branch streamlines, detach from the surface, and are carried downstream by the flow. (ii) Time-evolution of a surface population that advances towards a branching intersection through counter-advection and lateral diffusion. (E) Prediction from our model that the number of cells entering side-branch streamlines increases exponentially with time. (F) Surface colonization of wild-type (green) and surface-motility defective ΔpilTU (red) P. aeruginosa cells in a thiol-treated device after 15 hours of continuous flow. No cells were observed in the side channel (see Fig. S4A). (G) Plant colonization assay in which a tobacco plant leaf was inoculated with equal numbers of wild-type and ΔpilTU P. aeruginosa cells. After 7 days, wild-type cells (green) were observed in the upstream vasculature while ΔpilTU cells (red) were found at the inoculation site. (H) Schematic showing a generalized branched flow network (gray) with characteristic pore spacing λ and colonization of the network by bacterial communities (black) that migrate upstream a distance ℓ. Scale bars represent 100 μm in (F) and 5 mm in (G).

