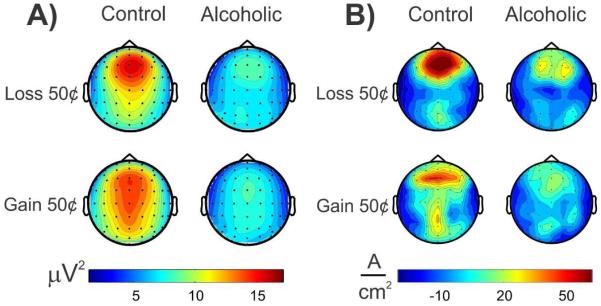
Fig. 3.
Topographic patterns of ERO theta activity representing total theta power (panel A) and of CSD maps computed from theta amplitude data (panel B) as compared between alcoholic and control group. These values were extracted within the time interval of 200-500 ms during the feedback of loss and gain of 50φ in a monetary gambling task. A) Alcoholics showed lower theta power in both loss and gain conditions; and B) alcoholics manifested lower CSD activations as well as topographic differences during loss and gain conditions. The CSD maps provided more prominent and useful information regarding the activation profiles across groups and conditions [Adapted from: Kamarajan et al. (2012)]

