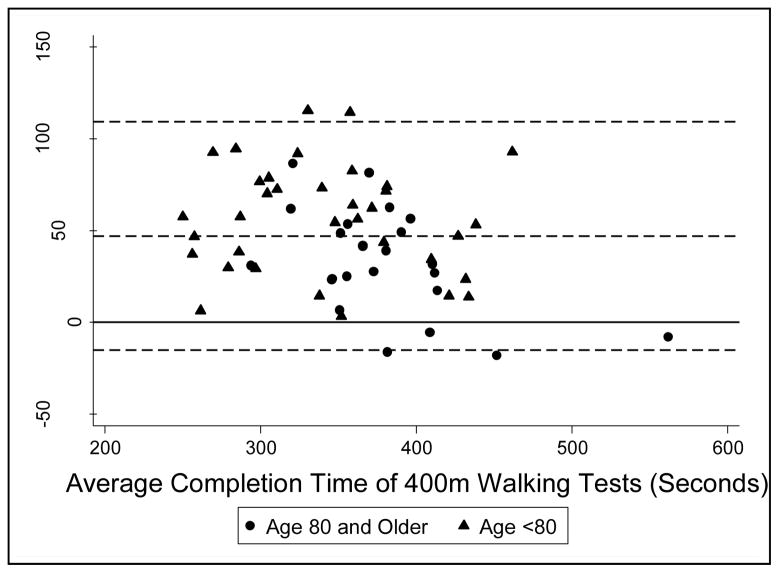
Figure 2.
Bland Altman Plot of Agreement between Fast and Usual-paced 400m Walks by Average Finish Timea
aThe difference in completion times was calculated by subtracting the fast 400m walk completion time from the usual-paced 400m walk completion time. The dashed line at 47.0 represents the mean time difference, and the upper and lower bounds indicate the two standard deviations above and below the mean completion time difference. The line at the y-value of 0 represents perfect agreement.

