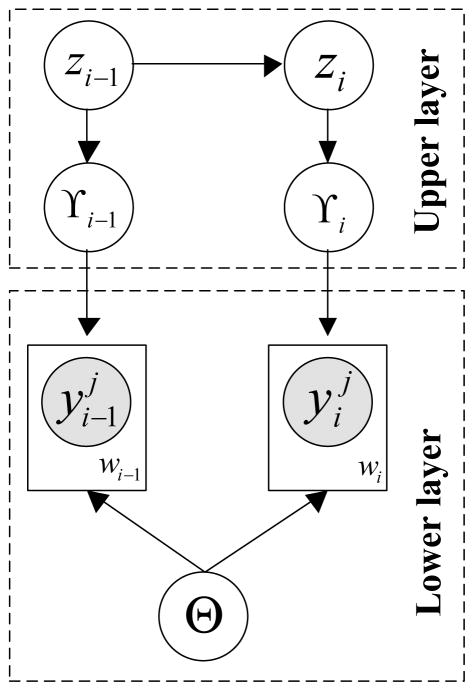
Figure 10.
Graphical illustration of our hierarchical dynamical model combining the GP and the LDS. The shaded nodes denote irregular observations. The γ node is the window representative we extract from the corresponding window and the z node is the hidden state we introduce in LDS to model the change of γs. The Θ node represents the shared covariance function parameters for all the GPs.

