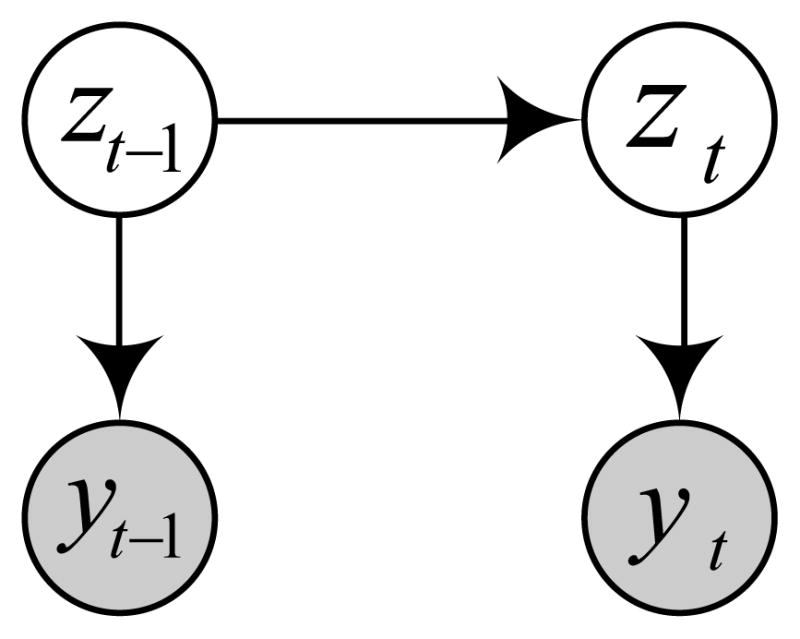
Figure 2.

Graphical representation of the LDS. Shaded nodes yt and yt−1 denote observation made at current and previous time steps. Unshaded nodes zt and z t−1 denote the corresponding hidden states. The links represent dependences among the observations and hidden states.
