Figure 3.

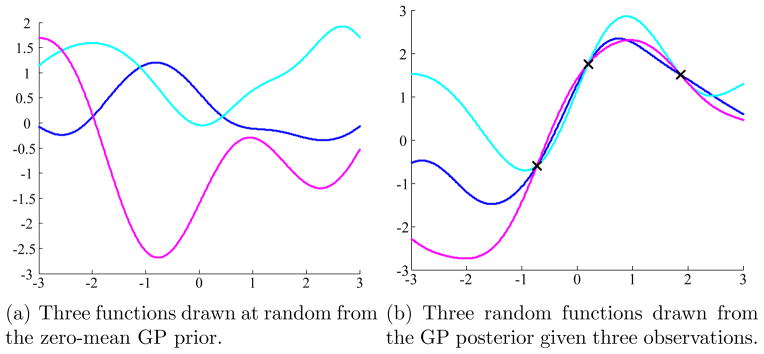
Graphical illustration of GP prior and posterior. In this example, we create X* as a linearly spaced vector from −3 to 3 with step size 0.01. We set the mean function m(·) = 0 and covariance function K(x, x′) = exp(−(x − x′)2/2).

Graphical illustration of GP prior and posterior. In this example, we create X* as a linearly spaced vector from −3 to 3 with step size 0.01. We set the mean function m(·) = 0 and covariance function K(x, x′) = exp(−(x − x′)2/2).