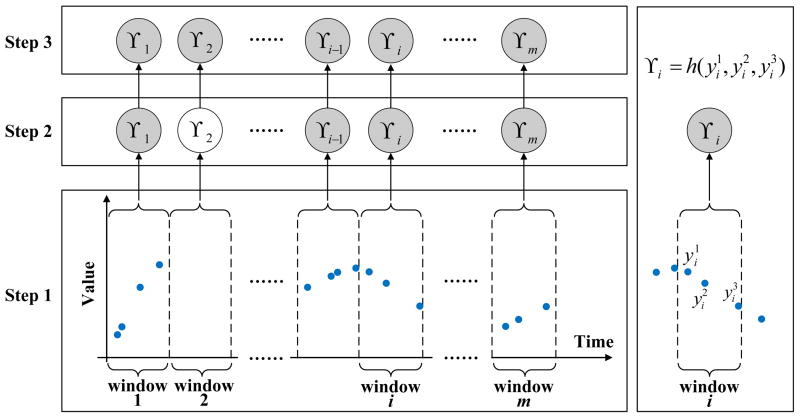
Figure 7.
Transformation of irregularly sampled time series to a discrete time series by WbS. The shaded nodes denote summary statistics calculated from the corresponding windows, such as γ1, γi in Step 2. The regular (unshaded) nodes denote empty summary statistics corresponding to windows with no readings, such as γ2. h in the right panel denotes the summary statistics estimation function.

