
Figure 3.
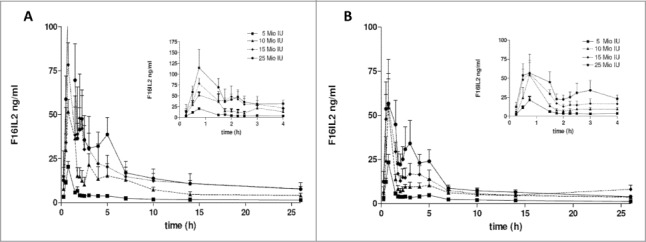
Pharmacokinetic analysis. Mean concentrations + standard deviation of F16-IL2 following administration of doxorubicin 25 mg/m2 and increasing doses of F16-IL2 (i.e., ♦ = 5 MIU, ○ = 10 MIU □ = 15 MIU ▪ = 25 MIU) are plotted versus time, by dose group; the dose is expressed in IL2 equivalents. Data were collected on day 1, corresponding to first F16-IL2 dose (A), and on day 8, corresponding to the administration of the second F16-IL2 dose (B), during the first cycle of treatment.