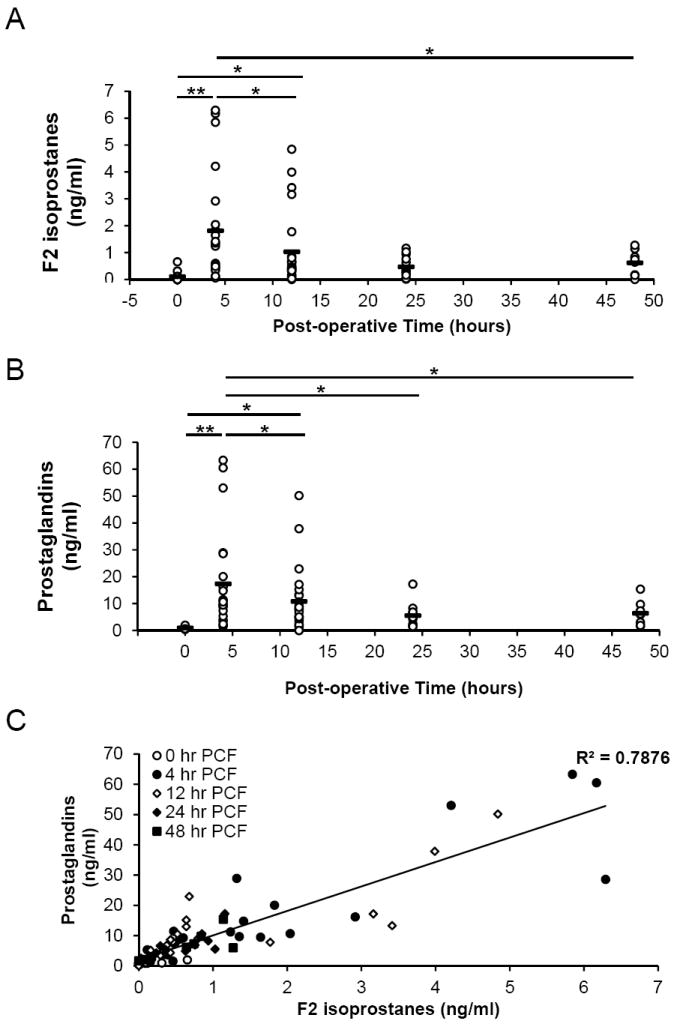
Figure 6. Quantitation of F2α Isoprostanes and Prostaglandins in postoperative PCF by LCMS/MS.

Lipids were extracted from post-operative pericardial fluid using solid phase extraction columns as described in the methods and analyzed by mass spectrometry. A) 8-iso-prostaglandin F2α concentrations and B) prostaglandin F2α concentrations were assessed in 0, 4, 12, 24, and 48 hour postoperative PCF patient samples. C) Regression analysis of F2α Isoprostanes plotted against prostaglandins over all time points. Data represented as individual patient values plus with the mean represented by a horizontal bar at 0 hours (n=13), 4 hours (n=22), 12 hours (n=23), 24 hours (n=12), and 48 hours (n=8). Statistical significance was determined using One-way Anova followed by Tukey’s Post hoc analysis, with p<0.05 indicating statistical significance. *= p<0.05, **= p<0.005.
