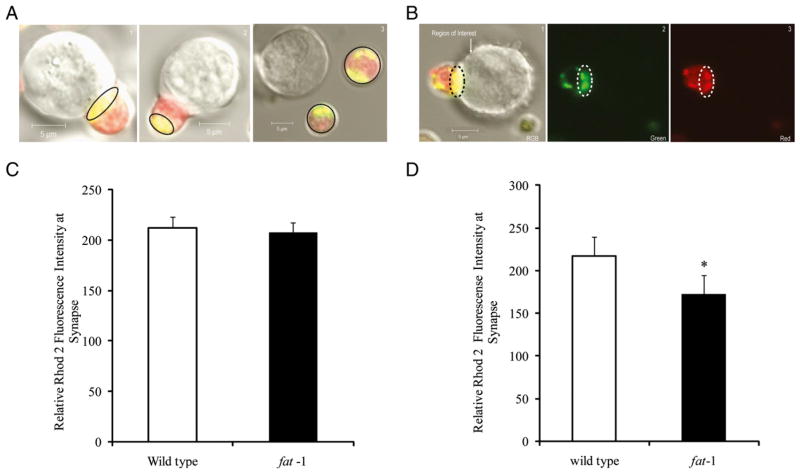
FIGURE 3.
Measurement of Ca2+ uptake at the IS. A, The region of interest where calcium signal is observed in confocal microscopy images (original magnification ×63) of Rhod-2 and Mitotracker-labeled cells: T cell with mitochondrial translocation to the IS (1); cell exhibiting a failure to translocate mitochondria to the IS (2); and T cell with no contact (3); therefore, no IS is formed. B, Representative confocal microscopy images (original magnification ×63) of Rhod-2 and Mitotracker-labeled cells RGB (1), green (2), red channels (3), respectively. ROIs at the T cell immune synapse were selected by drawing an oval or polygon as shown in dotted lines. Mean intensities from red and green channels were recorded to calculate Ca2+ values as described in the Materials and Methods. Scale bar, 5 μm. C, Effect of n−3 PUFA on mitochondrial Ca2+ at the IS only in cells with mitochondrial translocation to the IS. D, Comparison of mitochondrial Ca2+ measurements in CD4+ T cells in wild type (n = 26 cells from three mice) and fat-1 (n = 18 cells from three mice). *p < 0.05. ROI, region of interest.

