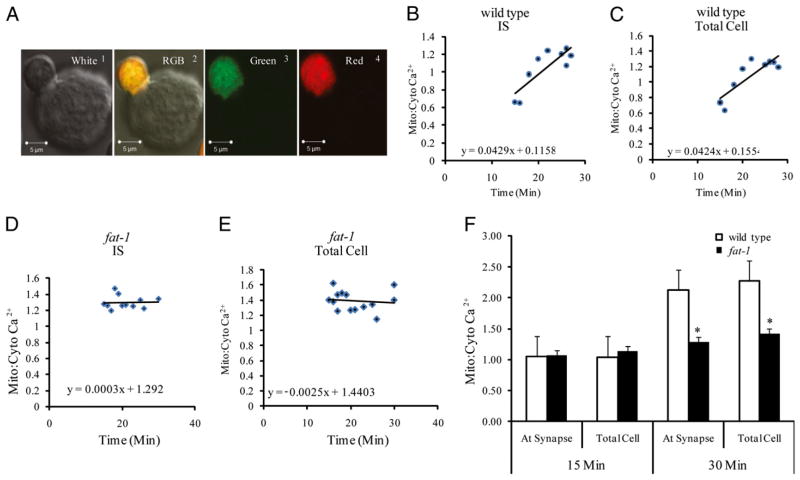
FIGURE 4.
Effect of n−3 PUFA on intracellular Ca2+. CD4+ T cells were coincubated with Fluo-4 AM (3 μM) and Rhod-2 AM (2.5 μM) for 30 min, and the mitochondrial-to-cytosolic Ca2+ ratio was determined. A, Representative confocal microscopy images (original magnification ×63) of Fluo-4 and Rhod-2 labeled cells white (1), RGB (2), green (3), red channels (4), respectively. B, Amplitude of intracellular Ca2+ response at the IS in wild type CD4+ T cells after coculture with Hybridoma 145-2C11 APCs. Data are from a representative experiment, 15–30 min after coculture; n = 5 independent experiments with 10–20 cells. C, Amplitude of total intracellular Ca2+ response in wild type CD4+ T cells. D, Amplitude of intracellular Ca2+ response at the IS in fat-1 CD4+ T cells. E, Amplitude of total intracellular Ca2+ response in fat-1 CD4+ T cells. F, Comparison of relative mitochondrial-to-cytosolic Ca2+ ratio at the IS versus total cell in CD4+ T cells from wild type (n = 116 cells from four mice) and fat-1 mice (n = 131 cells from five mice). Measurement at 15 min following the IS formation (left). Measurement at 30 min, the peak of response (right). *p < 0.05.

