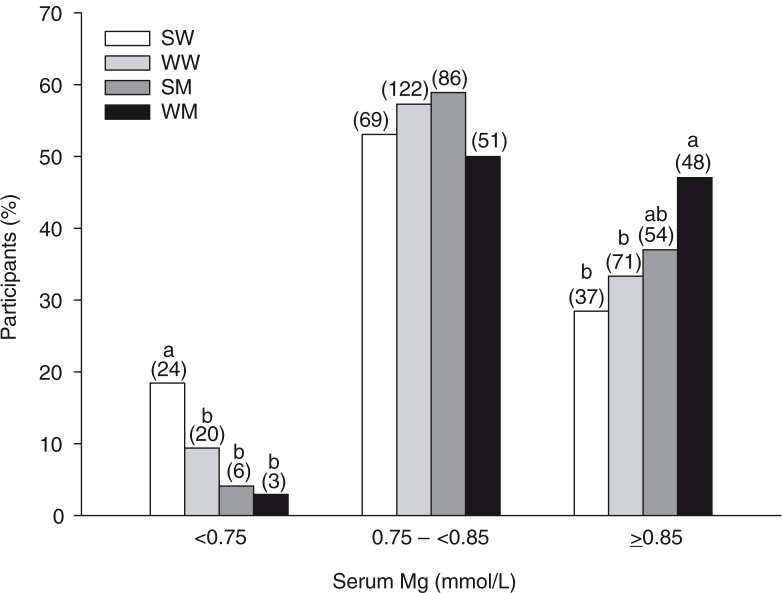
Fig. 2.
Classification of participants according to serum Mg concentrations. Bars represent the percentages of participants with hypomagnesemia (<0.75 mmol/L), chronic latent Mg deficiency (0.75 –<0.85 mmol/L), or normal serum Mg (≥0.85 mmol/L). Numbers above the bars in parentheses indicate the number of participants in that group. Bars without a common letter within each category differ, p<0.05. SM, South Asian men; SW, South Asian women; WM, white men; WW, white women.

