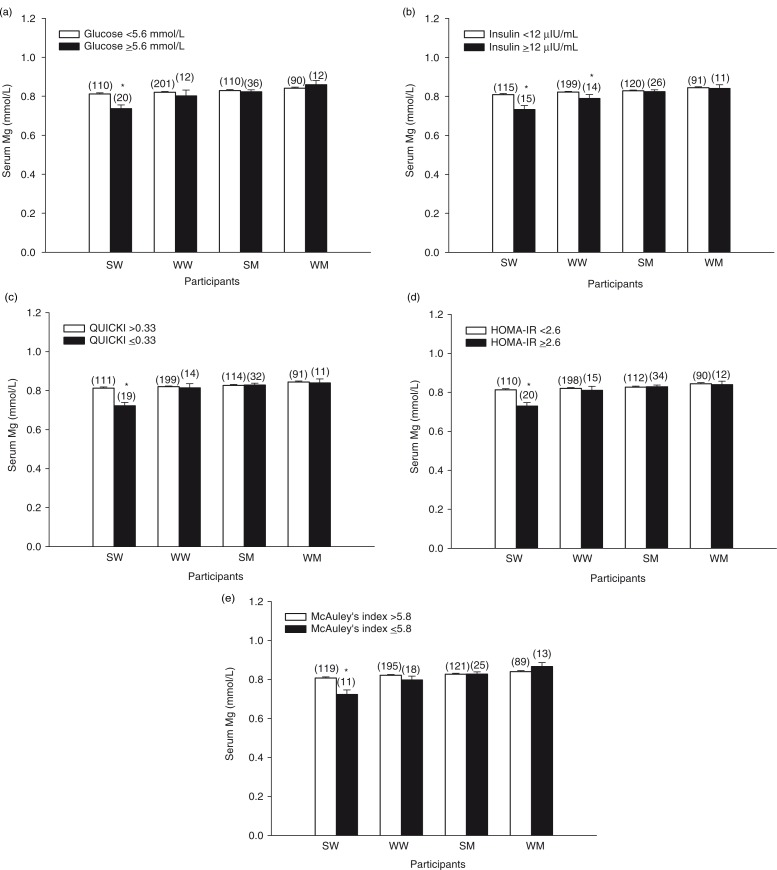
Fig. 4.
Serum Mg concentrations of participants categorized as having normal (white bars) or abnormal (black bars) values for fasting serum glucose (a), fasting plasma insulin (b), QUICKI (c), HOMA-IR (d) and McAuley's index (e) based on cut-off values for impaired glucose control and insulin resistance. Bars represent the means±SEM. Numbers above the bars in parentheses indicate the number of participants in that group. *Different from participants with normal values, p<0.05. SM, South Asian men; SW, South Asian women; WM, white men; WW, white women.

