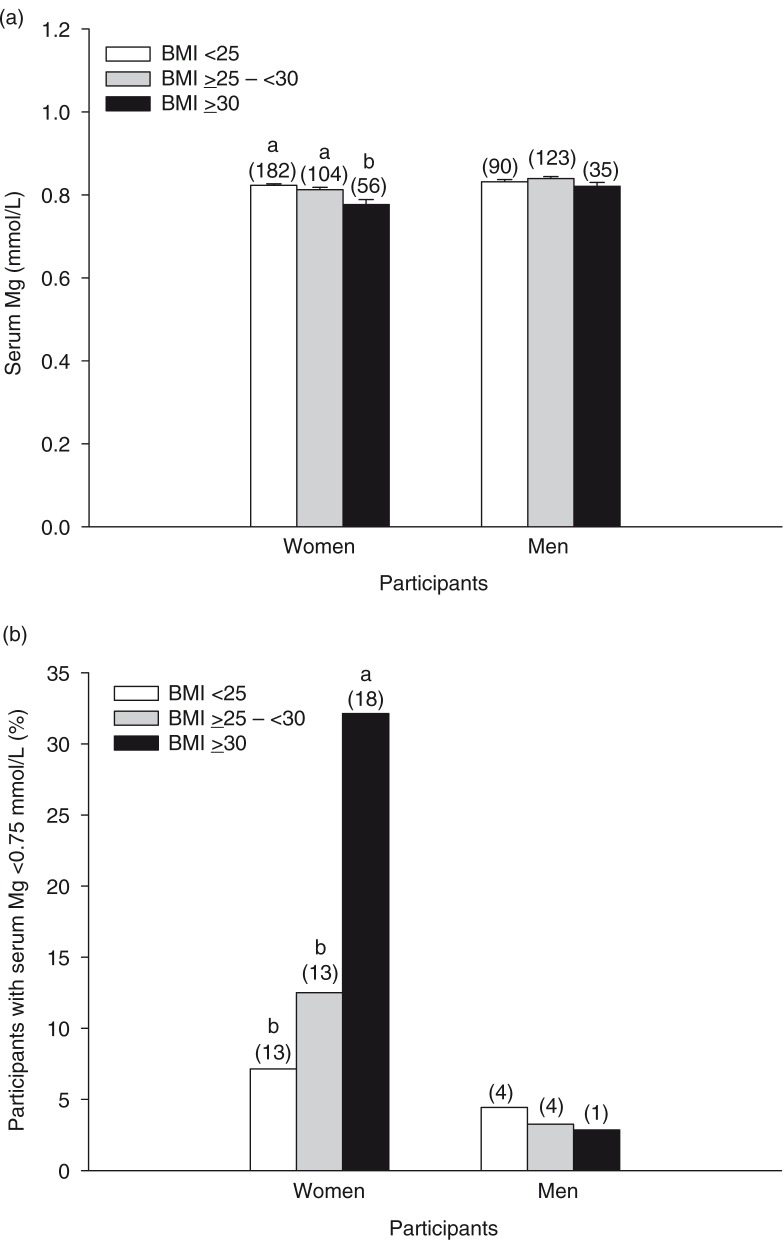
Fig. 5.
Serum Mg concentrations of women and men with a BMI <25 (normal weight), ≥25 –<30 (overweight), or ≥30 (obese) (a). Bars represent the means±SEM. Percentages of women and men with hypomagnesemia according to BMI categories (b). Numbers above the bars in parentheses indicate the number of participants in that group. Bars without a common letter differ, p<0.05.

