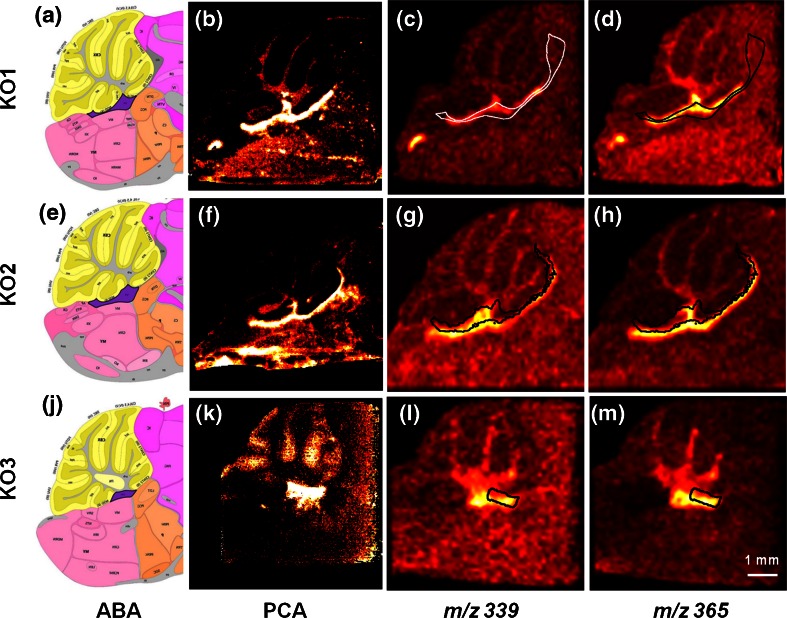
Figure 4.
Results of the final ABA-MSI co-registration presented for three knock-out biological replicates (KO1, 2, 3). Panels (a), (e), and (j) show the anatomic segmentation map of the ABA reference section used for the co-registration pipeline of the respective samples. Highlighted in violet color is the region of the fourth ventricle. Panels (b), (f), and (k) show corresponding score images of the principal components that extracted the hotspots correlated with the presence of fatty acids in the three knock-outs. Panels (c), (g), (l), and (d), (h), (m), depict co-registration examples of two mass channels correlated with the hotspots (m/z 339 – fatty acid 22:0, and m/z 365 – fatty acid 24:1, respectively). In black (or white) is shown the label of the fourth ventricle (and for KO1 and KO2 also of cerebellar aqueduct). The scale bar indicates a 1 mm distance

