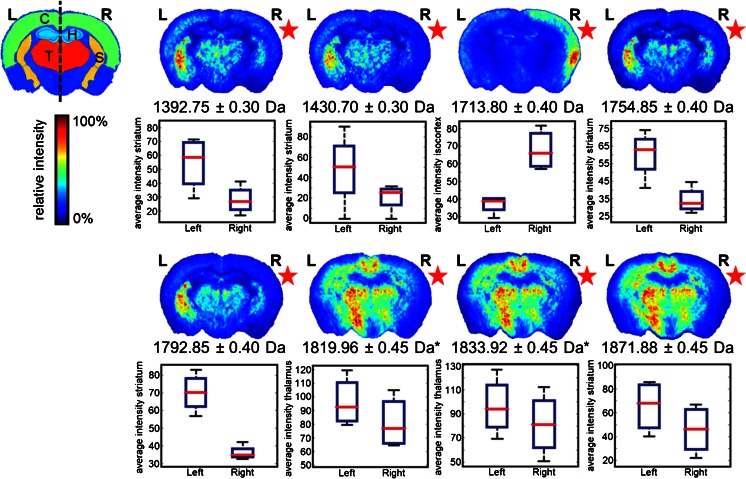
Figure 3.
Peptide MSI dataset: differences between CSD (right, R) and control hemisphere (left, L) in R192Q-CSD mouse brain. Each image corresponds to the visualization of the average distribution of a particular m/z feature in five mouse brains after alignment to the ABA (*P < 0.05, Student’s t-test). C = cortex; T = thalamus; H = hippocampus; S = striatum

