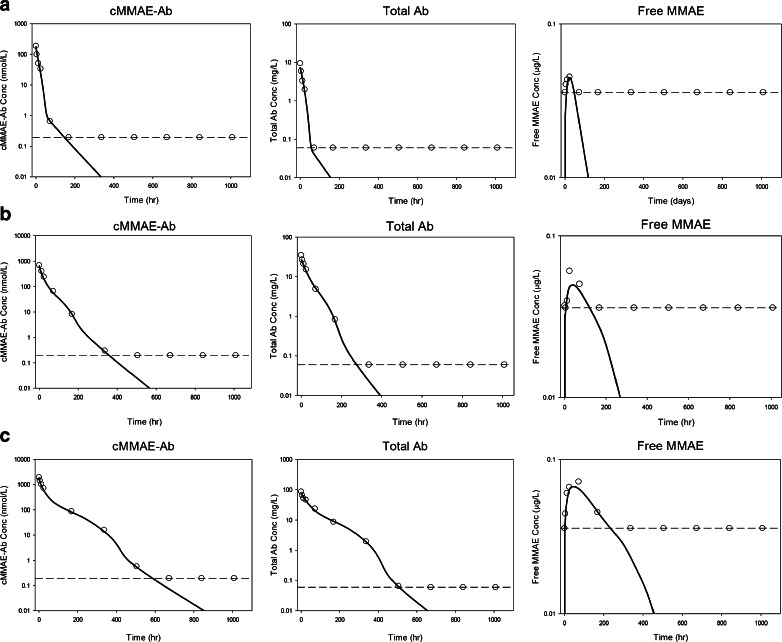
Fig. 6.
Individual fitting plots for a representative subject after a single dose of (a) 0.3 mg/kg, (b) 1 mg/kg, and c) 3 mg/kg of anti-CD79b ADC. Dashed line: concentration level of ≤ LLOQ or ≤ MQC; open circle: observed PK concentrations; open circles on the dashed line: observed PK concentrations with ≤ LLOQ or ≤ MQC values; solid line: individual model prediction; Tab: total antibody; acMMAE: antibody-conjugated MMAE; MMAE: monomethyl auristatin E.

