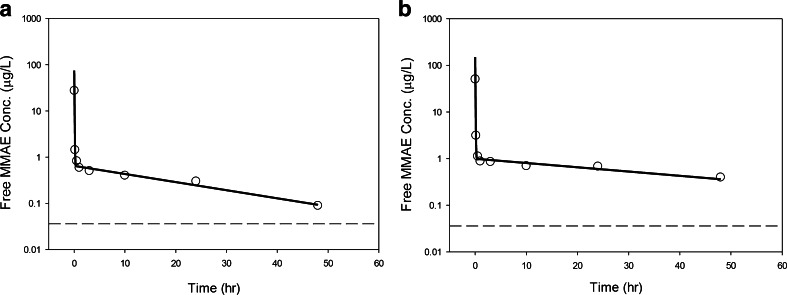
Fig. 7.
Individual fitting plots for a representative subject after a single dose of (a) 0.03 mg/kg, and (b) 0.063 mg/kg of IV MMAE. Dashed line: concentration level of below quantification limit (BQL); open circle: observed PK concentrations; solid line: individual model prediction; MMAE: monomethylauristatin E.

