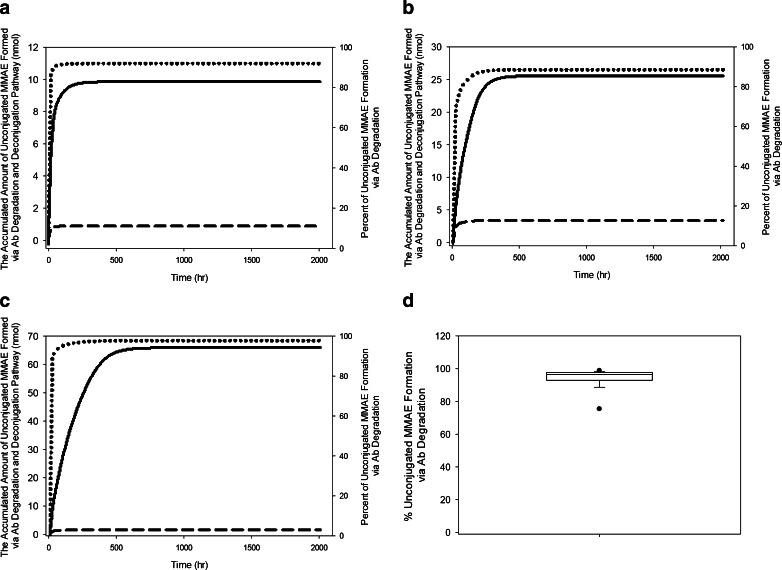
Fig. 9.
Unconjugated MMAE release-time profile for a representative subject after a single dose of a) 0.3 mg/kg, b) 1 mg/kg, and c) 3 mg/kg of anti-CD79b-MMAE ADC. d) Mean percentage of unconjugated MMAE release due to conjugate proteolytic degradation after a single dose of ADC. Solid line – unconjugated MMAE release via Antibody (Ab) proteolytic degradation; dashed line – unconjugated MMAE release via deconjugation pathway; dotted line – percent of unconjugated MMAE release via conjugate proteolytic degradation pathway.

