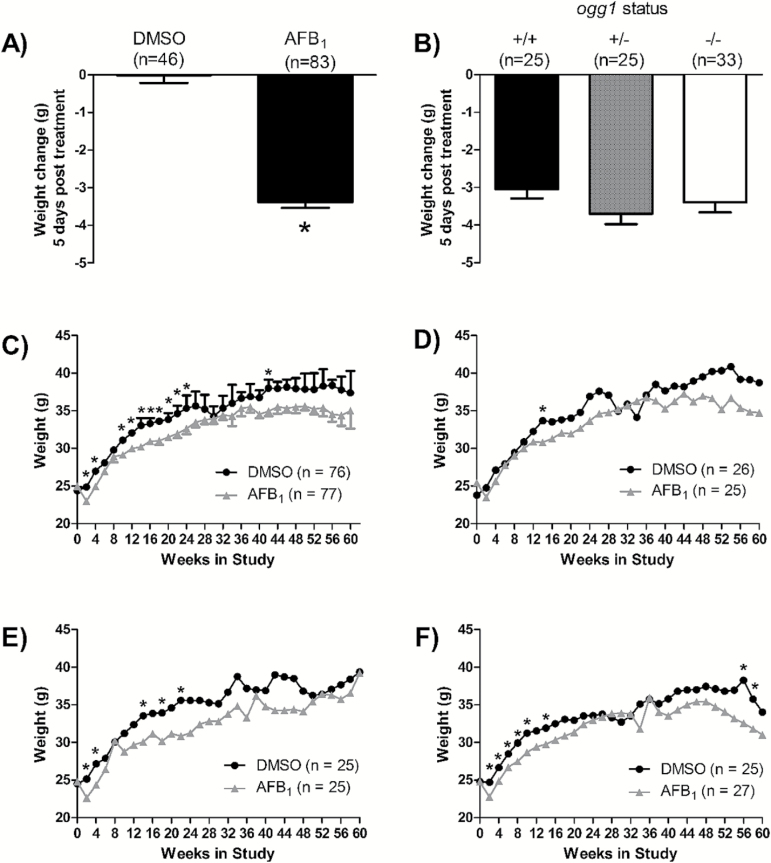
Figure 2.
Mouse weights throughout the tumourigenesis study. (A) weight change 5 days post treatment in all mice treated with DMSO or AFB1 compared with time 0; (B) weight change 5 days post-treatment in AFB1-treated ogg1 (+/+), (+/−) and (−/−) mice, compared with time 0; (C) comparison of weights of all control and all treated mice, regardless of genotype; weights of control and treated: (D) ogg1 (+/+) mice; (E) ogg1 (+/−) mice; and (F) ogg1 (−/−) mice. Error bars have been removed from graphs D–F for clarity. Significantly different from DMSO control at that time point (*P < 0.05, unpaired t-test (A, C–F); P > 0.05, one-way ANOVA with a Newman–Keuls post hoc test (B).

