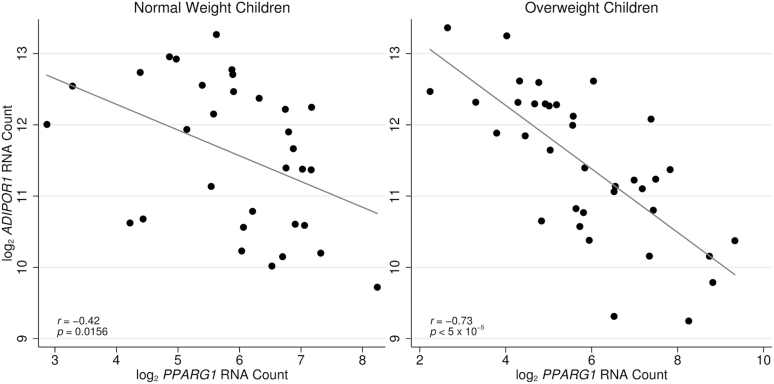
Figure 5.
Relationship between ADIPOR1 and PPARG1 nCounter expression by overweight status. A strong negative correlation was observed between ADIPOR1 expression and PPARG1 expression (r = −0.60, P < 5×10⁻⁵). This relationship was substantially stronger in overweight children (r = −0.73, P < 5×10⁻⁵) than in normal weight children (r = −0.42, P = 0.0156).

