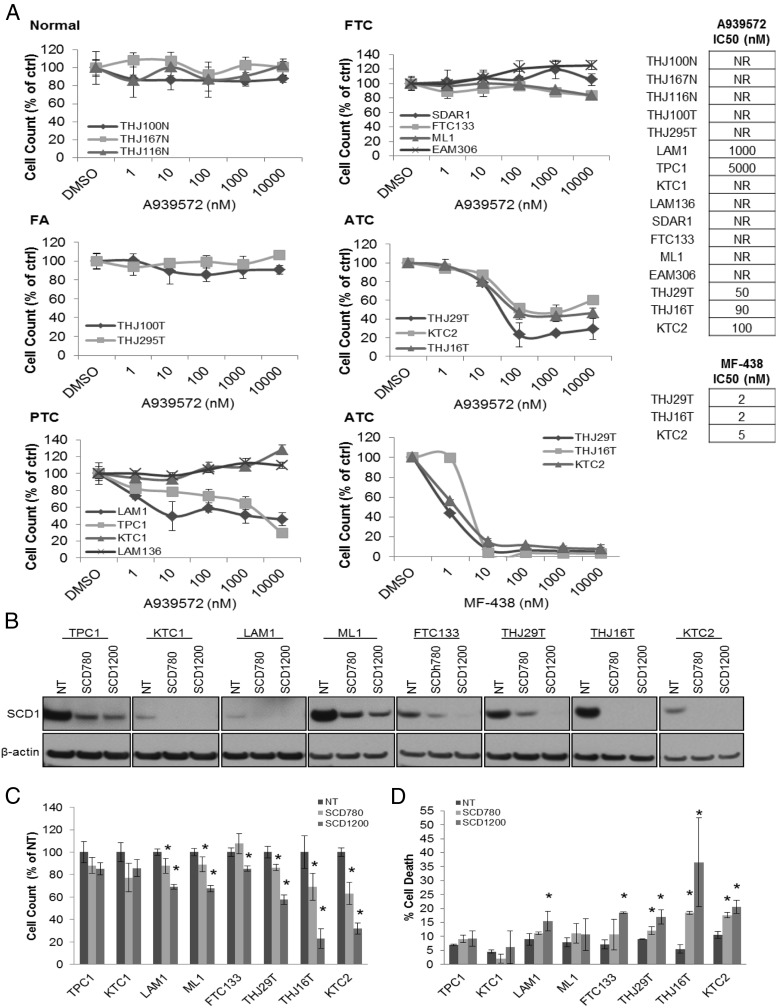
Figure 2.
Effects of pharmacological and genetic SCD1 inhibition in thyroid cells. A, Proliferative dose response of thyroid cells to the SCD1 small molecule inhibitor A939572 in normal thyroid cells, FA cells, PTC cells, FTC cells, and ATC cells. Proliferative dose response of ATC cells to the small molecule SCD1 inhibitor MF-438. Results are presented as percent cell number relative to DMSO-treated control. B, Western blot for SCD1 protein expression in NT control and target SCD1 (SCD780, SCD1200) lentivirus shRNA-infected cells. β-Actin is shown to demonstrate equal protein loading. C, Proliferation of NT vs target SCD1 knockdown cells. Results are presented as percent cell number relative to NT control. D, Summary bar graph of cell death analysis of NT and target SCD1 knockdown cells. *, P < .05 as compared with NT control cells.

