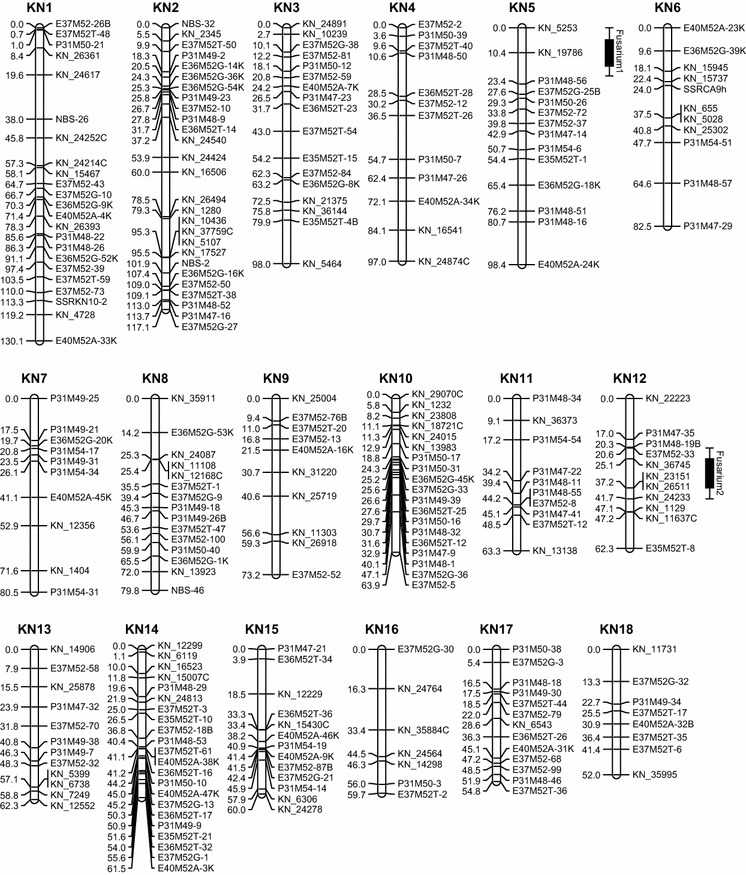
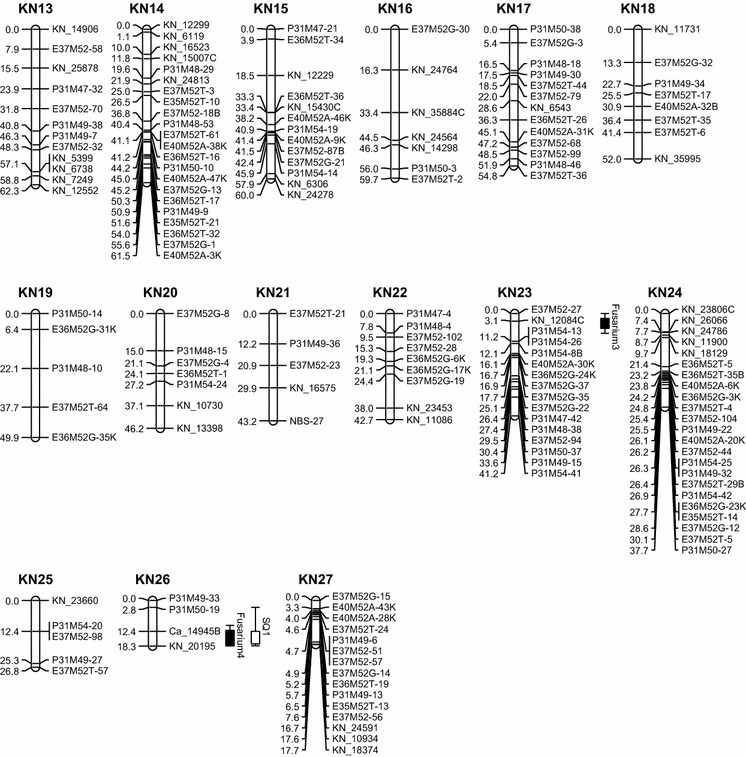
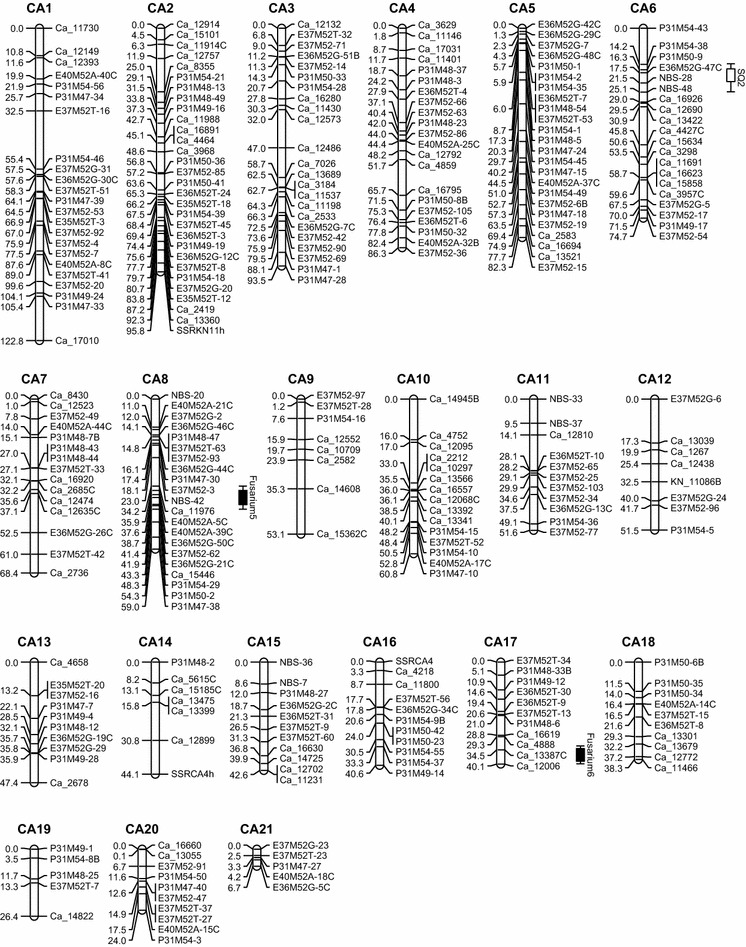
Fig. 2.


Genetic maps of T. gesneriana “Kees Nelis” and T. fosteriana “Cantata.” “KN” and “CA” represent linkage groups of “Kees Nelis” and “Cantata,” respectively. Putative QTLs were represented by boxes extended by lines representing the confidence intervals
