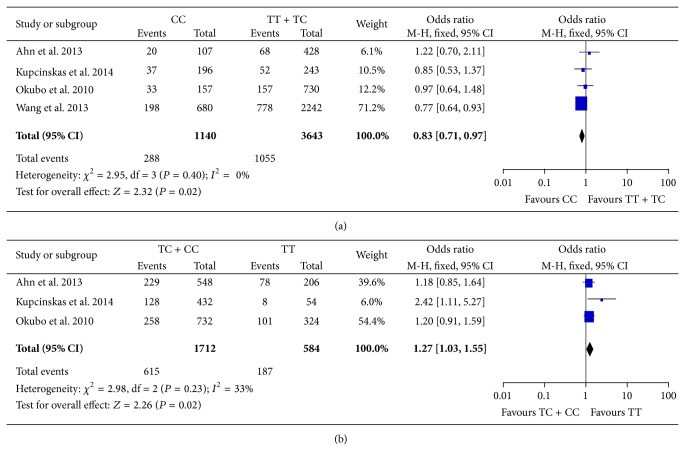
Figure 3.
Forest plots of meta-analyses on rs11614913 in miR-196a2. (a) Subgroup analysis in diffuse type of gastric cancer using recessive model (CC versus TT + TC). (b) Subgroup analysis in intestinal type of gastric cancer under dominant model (TC + CC versus TT). The blue squares and corresponding horizontal lines indicate odds ratio of individual study. The area of the squares reflects weight of indicated study. The black filled diamond represents pooled odds ratio and 95% confidence interval.

