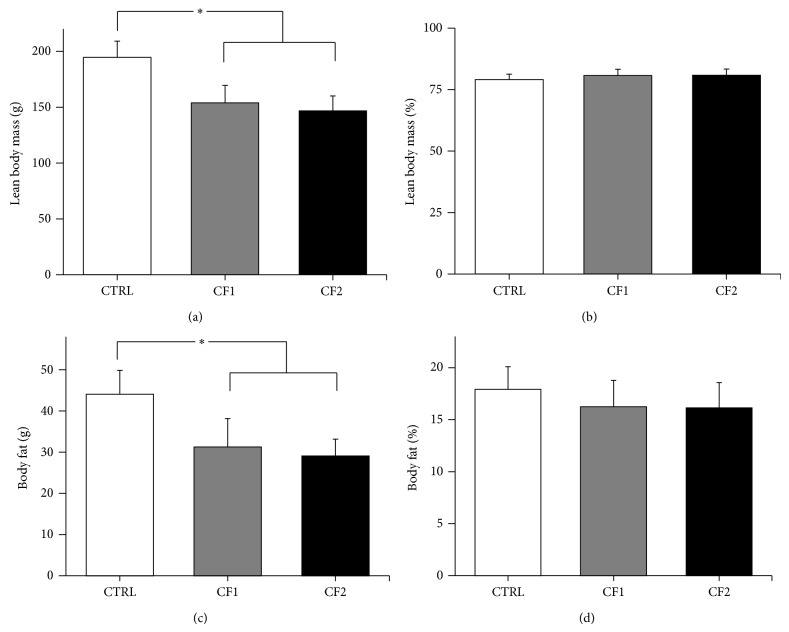
Figure 2.
Effect of caffeine exposure on lean body mass and body fat as determined by DXA. Comparison of (a) lean body mass, (b) the percentage of lean body mass, (c) total body fat, and (d) the percentage of body fat between the control and caffeine-fed groups at the end of experiment. Lean body mass (%), lean body mass divided by total body mass; body fat (%), total body fat divided by total body mass. Values are expressed as mean ± SD. CTRL, control; CF1, caffeine 120 mg/kg/day; CF2, caffeine 180 mg/kg/day. ∗ p < 0.001 versus CTRL.

