
Figure 3.
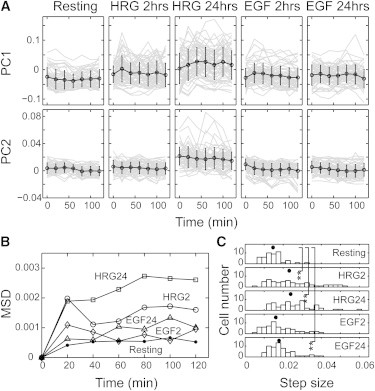
Single-cell trajectories of the major chemical components. (A) Trajectories of PC1 (upper) and PC2 (lower) in single cells. Black lines indicate averages with SDs. Gray lines show single-cell trajectories with time. (B) Time evolution of the two-dimensional MSDs of the trajectories under each condition in the PC1-PC2 plane. (C) Histograms of the average step sizes of single cells for 2 h under the indicated conditions. Black dots indicate the median. ∗∗p < 0.01 on the Wilcoxon test.