
Figure 2.
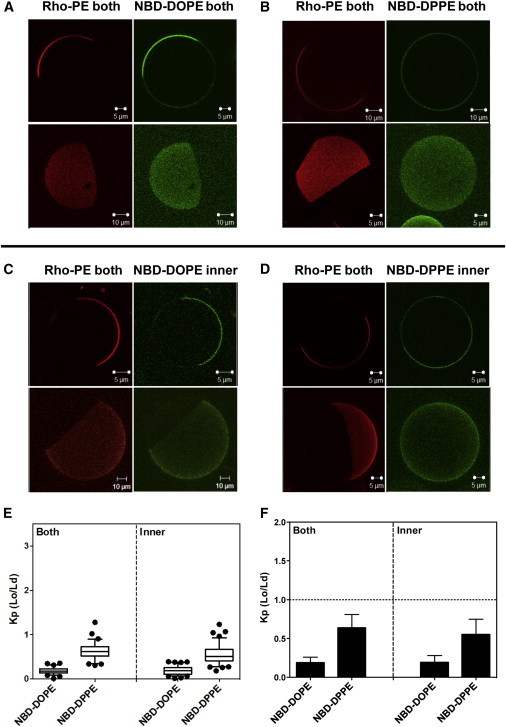
Images and NBD partition data for symmetric vesicles composed of 1:1 (mol/mol) egg SM/DOPC with 37 mol % cholesterol. Vesicles were labeled with Rho-DOPE and NBD-DOPE (A) or NBD-DPPE (B) in both leaflets or with Rho-DOPE in both leaflets and NBD-DOPE (C) or NBD-DPPE (D) in the inner leaflet. (Outer-leaflet NBD was reduced with sodium dithionite to restrict NBD fluorescence to the inner leaflet.) Two-dimensional cross-section images (upper panels in A–D) and three-dimensional reconstruction images (bottom panels in A–D) shown. The two- and three-dimensional images are from different vesicles. (E and F) Box plot and bar graph representations, respectively, of the NBD-DOPE and NBD-DPPE partition coefficient Kp (Lo/Ld). NBD-DOPE in both leaflets, n = 21; NBD-DOPE in the inner leaflet, n = 27; NBD-DPPE in both leaflets, n = 27; and NBD-DPPE in the inner leaflet, n = 33. The value of n here and below equals the number of vesicles analyzed. Kp (Lo/Ld) is the ratio of NBD fluorescence in Lo domains divided by that in Ld domains; Kp estimated here and in the following figures used intensity at 3–5 positions within Ld regions and 3–5 positions within Lo regions in each vesicle. To see this figure in color, go online.