
Figure 4.
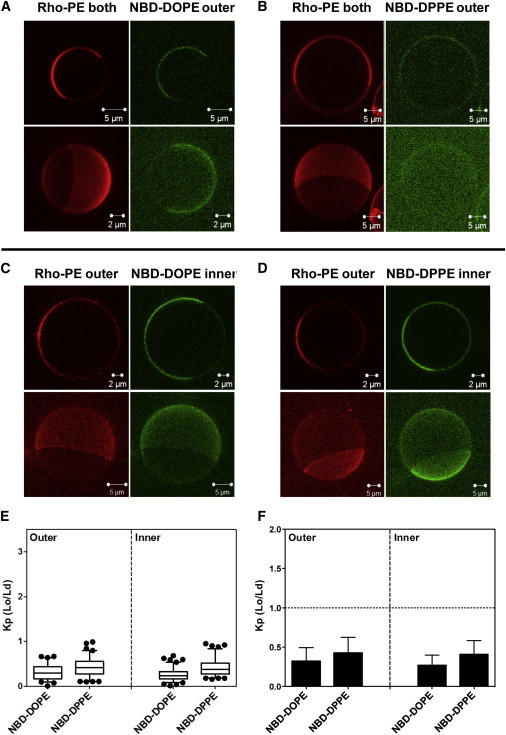
Images and NBD partition data for asymmetric milk SM + DOPCo/DOPCi/∼37 mol % cholesterol GUV. GUV labeled with (A) NBD-DOPE or (B) NBD-DPPE in the outer leaflet, and with NBD-DOPE (C) or NBD-DPPE (D) in the inner leaflet. (C and D) To restrict NBD fluorescence to the inner leaflet, outer leaflet NBD was reduced with sodium dithionite. For GUV with outer-leaflet NBD lipid, Rho-DOPE was in both leaflets; for GUV with inner-leaflet NBD lipid, Rho-DOPE was exchanged into their outer leaflet. (A–D) Two-dimensional cross-section images (upper panel) and three-dimensional reconstruction images (bottom panel) were shown. Two- and three-dimensional images were taken from different vesicles except for (B), in which they are from the same vesicle to allow visualization of NBD partitioning. (E and F) Box plot and bar graph representations, respectively, of NBD-DOPE and NBD-DPPE Kp (Lo/Ld). NBD-DOPE in the outer leaflets, n = 18; NBD-DOPE in the inner leaflet, n = 22; NBD-DPPE in the outer leaflet, n = 17; NBD-DPPE in the inner leaflet, n = 18. To see this figure in color, go online.