
Figure 6.
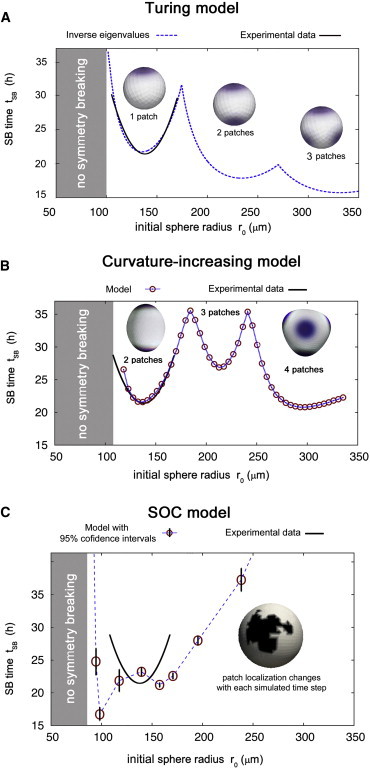
Different models considering symmetry breaking time tSB depending on system size. (A) Turing model. (B) Curvature-increasing model. (C) SOC model. (Black solid lines) Approximated experimental data taken from Soriano et al. (19). (Dashed blue lines and red points) Model data. (Gray shaded) Regions without symmetry breaking. To see this figure in color, go online.