
Figure 6.
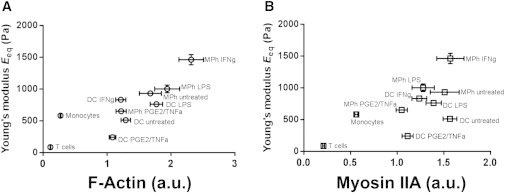
(A and B) Plots of the equivalent Young’s modulus Eeq versus (A) total F-actin and (B) total myosin IIA heavy chain contents measured in confocal microscopy images. Pearson correlation coefficients were calculated (ractin = 0.83, rmyosin = 0.67).