
Figure 1.
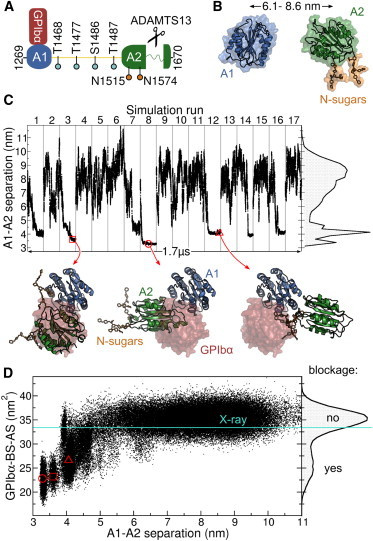
Blockage of the GPIbα binding site in the VWF revealed by MD simulations of the VWF A1 and A2 domains. (A) Scheme illustrating the human VWF-A1A2 fragment (residues 1269 to 1670). The A1 and A2 domains are connected by a 30 residue linker (yellow). GPIbα anchors platelets to VWF by binding to the A1 domain. VWF size is controlled by cleavage of the unfolded A2 domain by ADAMTS13. O-linked (cyan) and N-linked sugars (N-sugars, orange) are found within the fragment. (B) One of the multiple starting conformation used in the MD simulations (protein as cartoon and surface and sugars as sticks). The domain-domain center of mass (A1-A2) separation is indicated with the black arrow. (C) A1-A2 separation along the concatenated MD simulation time. Gray lines separate individual MD runs. The right plot shows the normalized histogram of the A1-A2 separation. Conformations at the bottom show examples with the two domains in contact (cartoon) contrasted to the region occupied by GPIbα when it binds to A1 (red surface), taken at the instants marked with the red symbols. (D) GPIbα binding site accessible surface (GPIbα-BS-AS) as a function of the A1-A2 separation (main panel) and its normalized histogram (right plot), recovered from MD simulations. Reduced GPIbα-BS-AS values indicate blockage of the GPIbα binding site. The GPIbα-BS-AS derived from the VWF A1-GPIbα complex x-ray structure (16) is depicted by the cyan line. The red symbols correspond to the conformations shown in (C). To see this figure in color, go online.