
Figure 4.
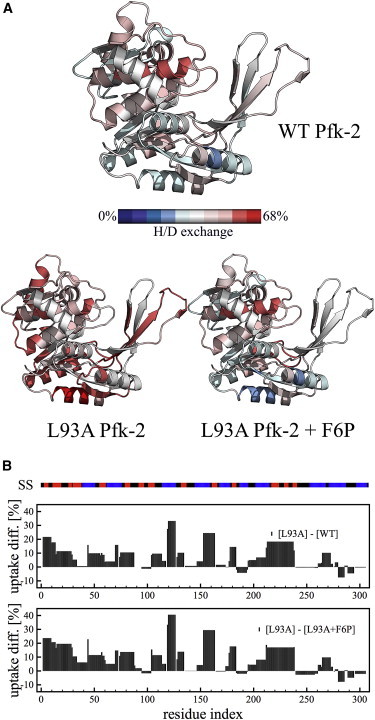
Comparison of the solvent accessibility of L93A and WT Pfk-2 under native conditions. (A) Visualization of the extent of exchange over local regions of each subunit for WT Pfk-2 (top), L93A Pfk-2 (bottom left), and L93A Pfk-2 with F6P (bottom right). The coloring scheme goes from no exchange (blue) to 68% uptake (red), which is the maximum uptake observed for the N-terminal residues 1–7 from the L93A Pfk-2 mutant. (B) Difference in deuterium uptake of the L93A mutant when compared with the WT protein (top) and with the L93A Pfk-2 incubated with F6P to induce dimerization (bottom). The secondary structure content per residue (SS) is indicated with the color bar on top of the exchange plots, being red for strands, blue for helices, and black for loops.