
Figure 6.
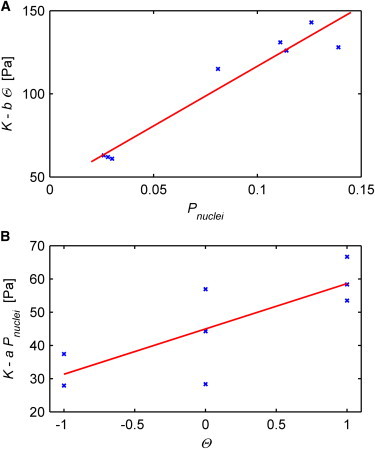
Local spinal cord tissue stiffness depends on cell distribution and axon orientation. (A and B) Semi-independent linear correlations; K reduced by the influence of and versus and , respectively. Blue crosses and red lines represent single data points and linear fits. The Pearson’s linear correlation coefficient is 0.97 (A) and 0.79 (B). To see this figure in color, go online.