. 2015 Apr 22;13:127. doi: 10.1186/s12967-015-0487-z
© Wenping et al.; licensee BioMed Central. 2015
This is an Open Access article distributed under the terms of the Creative Commons Attribution License (http://creativecommons.org/licenses/by/4.0), which permits unrestricted use, distribution, and reproduction in any medium, provided the original work is properly credited. The Creative Commons Public Domain Dedication waiver (http://creativecommons.org/publicdomain/zero/1.0/) applies to the data made available in this article, unless otherwise stated.
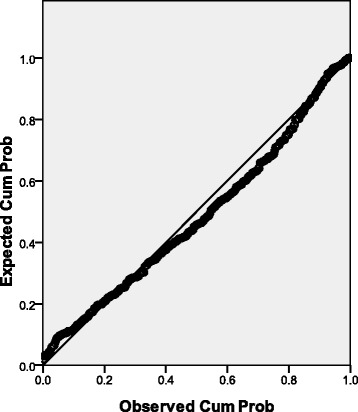
Figure 3.

Normal P-P Plot of the health test index (HTI).
