
Figure 4. Direct visualization of two SpoIIIE clusters at the septal midpoint.
(A) PALM image of single focus and a rare dual focus of SpoIIIE-Dendra2 in wild type B. subtilis (TCF25), with FM5-95 stained membranes (white). The bottom PALM images are zoomed in from the yellow boxes. Bar is 500 nm and 50 nm for overlaid and PALM images, respectively. Membrane is diffraction-limited image. (B) Schematic diagram of septal thinning. (I) After septation, septal peptidoglycan is degraded by a complex containing the SpoIID, SpoIIM and SpoIIP proteins (pacman) and the second potential division site is blocked. (II) Elimination of SpoIIDMP in the ΔspoIIDMP (spoIID, spoIIM, spoIIP) strain inhibits septal thinning without impairing DNA segregation. (III) Elimination of σE in the ΔσE (spoIIGB) strain inhibits septal thinning and produces disporic cells without impairing DNA segregation. (C) PALM images of SpoIIIE-tdEos in ΔσE strain (JS03). Classification of PALM images as dual foci or single foci were defined according to the parameters of our cluster analysis. Scale bar is 500 nm and 50 nm for overlaid and PALM images, respectively. Membrane is diffraction-limited image. (D) PALM images of SpoIIIE-tdEos in ΔSpoIIDMP strain (JLG571). The diffraction-limited images of the membranes (white) and the DNA (green) were obtained by staining with FM5-95 and DAPI, respectively. The relative forespore DAPI intensity was ∼25% in both sporangia. SpoIIIE dual foci are shown in the left panels. In-gel fluorescence and western blots of the different SpoIIIE fusion proteins used here can be found in Figure 4—figure supplement 7.

Figure 4—figure supplement 1. Classification of cells in vegetative, monosporic and disporic cells at t1.75.
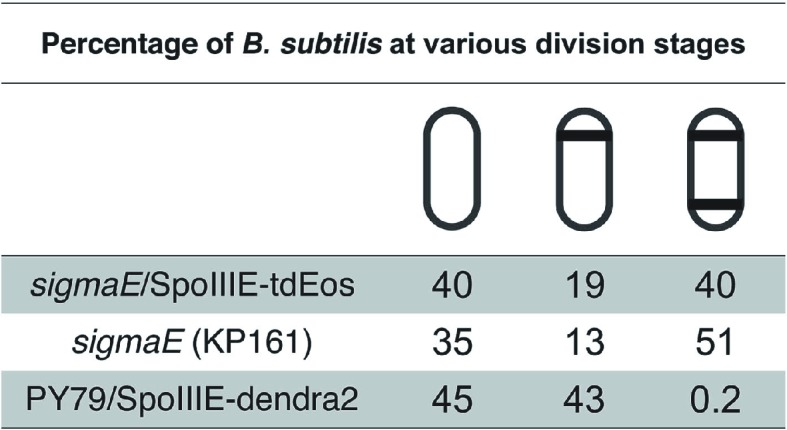
Figure 4—figure supplement 2. SpoIIIE segregates the chromosomes in the ΔσE strain.

Figure 4—figure supplement 3. Examples of single foci in the ΔσE strain when SpoIIIEWT is fused to tdEos.
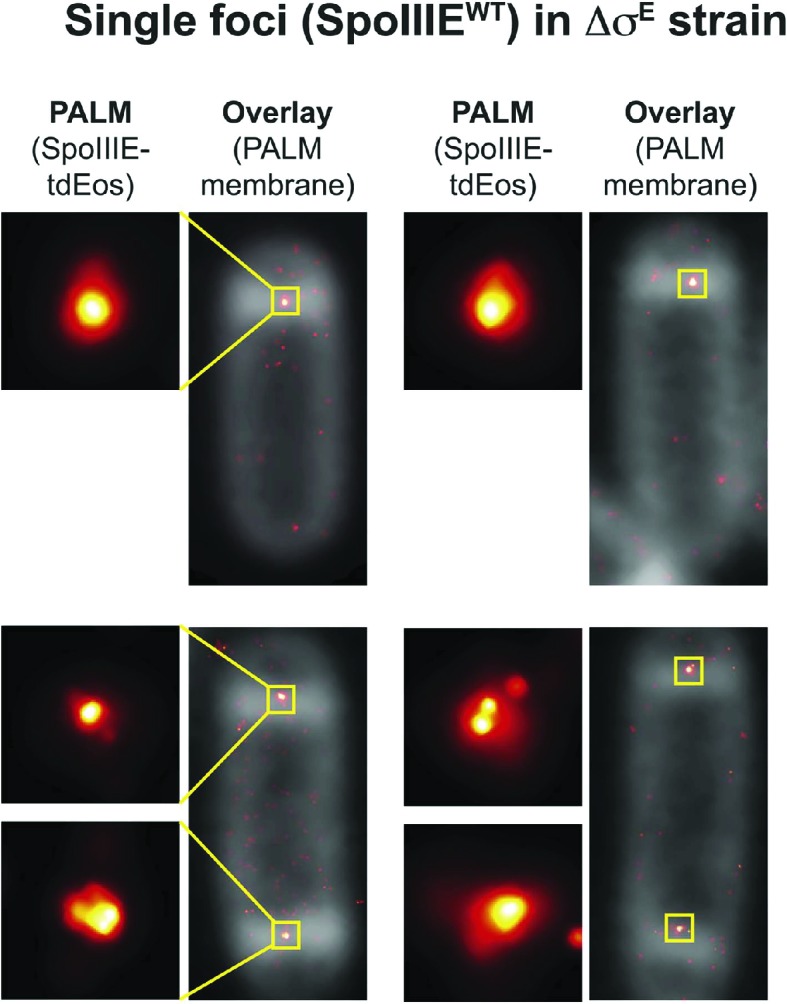
Figure 4—figure supplement 4. Distribution of single and double foci in monosporic and disporic sporangia.

Figure 4—figure supplement 5. SpoIIIE ATPase mutant (SpoIIIEATP−) fused to tdEos in ΔσE strain also organizes into dual foci.
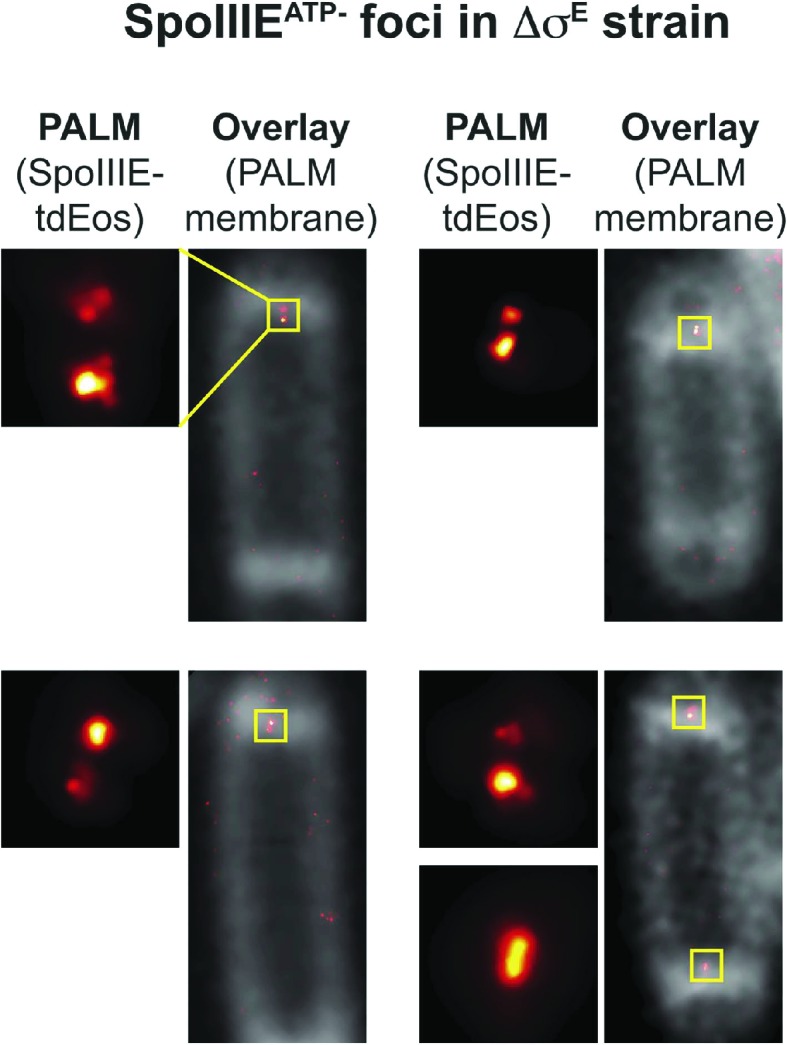
Figure 4—figure supplement 6. SpoIIIE organizes into dual foci at the septum of sporangia where chromosome transport is incomplete.
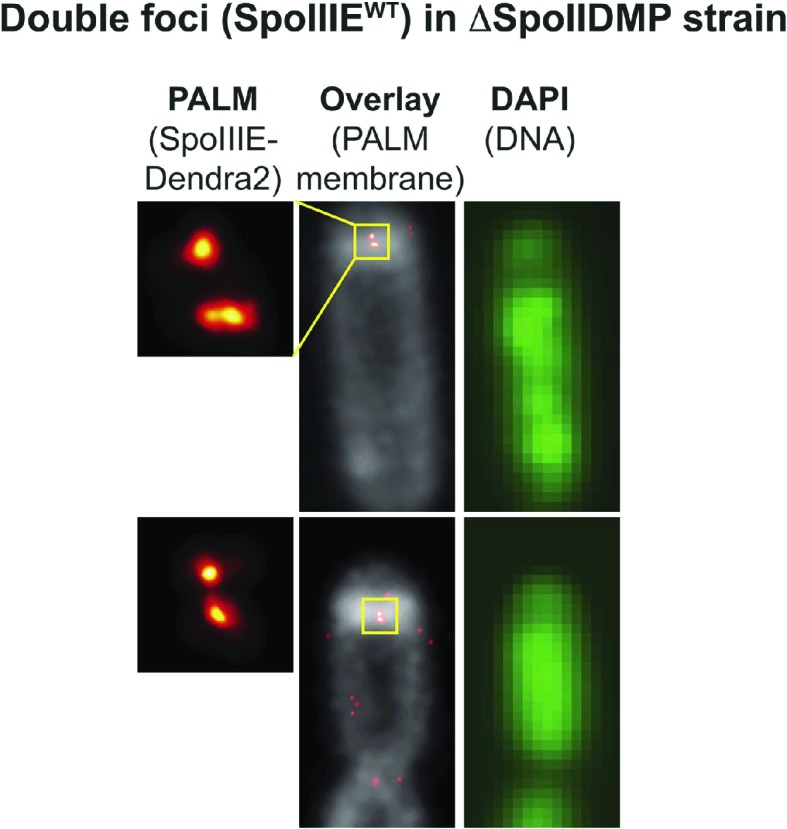
Figure 4—figure supplement 7. In-gel fluorescence and western blot of the SpoIIIE fusion proteins used in this study.
