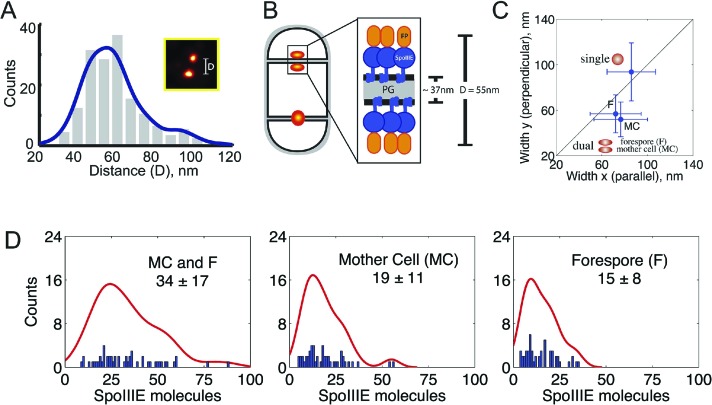
Figure 5. quantitative PALM (qPALM) of SpoIIIE complexes.
(A) The distances (D) between the centers of each cluster from SpoIIIE-tdEos dual foci in ΔσE strain (JYS03). The average distance between clusters, indicated by the main peak value of the kernel density estimator (blue line), is 55 nm. (B) Schematic diagram of SpoIIIE (blue) at the division septum in ΔσE strain. To estimate the thickness of the peptidoglycan (PG) we subtracted twice the width of the lipid bilayer (3 nm; Lewis and Engelman, 1983) and twice the height of SpoIIIE (6 nm), based on the FtsK crystal structure (Massey et al., 2006) from 55 nm, to give 37 nm. FP, fluorescent protein. (C) Dimensions of single SpoIIIE-Dendra2 foci and resolved clusters in dual foci. Focus widths in foci parallel (x) and perpendicular (y) to the septum were calculated as described in supplementary methods. For single foci the parallel- and perpendicular-width (in nm) are 86 ± 10 and 94 ± 12 respectively, for dual foci, the forespore proximal cluster is 64 ± 11 and 57 ± 8, the mother cell proximal cluster 77 ± 12 and 52 ± 7. Error bars, standard deviation from Nsingle = 221, Ndual foci = 51. (D) Distribution of the number of SpoIIIE-Dendra2 molecules determined by qPALM at the septum in the mother cell, in the forespore and in both. Data (blue bars) are represented by Kernel Density Estimator (red solid lines). Mean and standard deviations from Nfoci = 51 are shown. More details about qPALM and the algorithm employed for quantification can be found in ‘Materials and methods’.
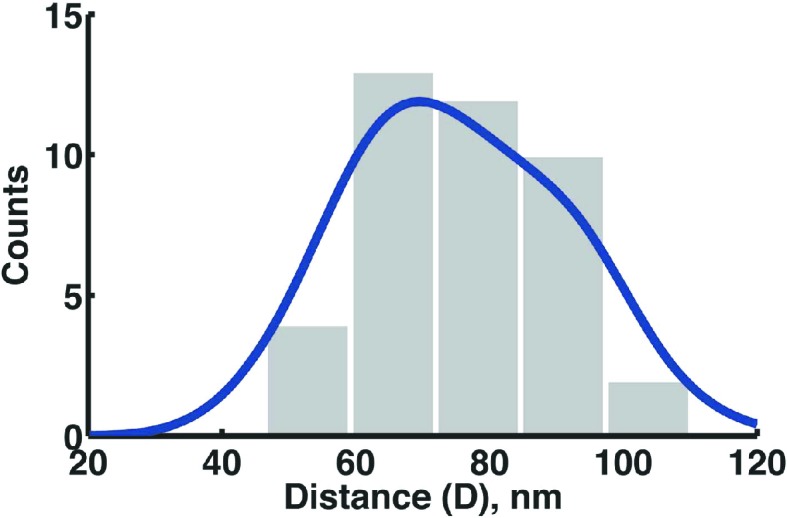
Figure 5—figure supplement 1. Distance distribution between the centers of each of the clusters from the SpoIIIE-Dendra2 dual foci in ΔσE strain.

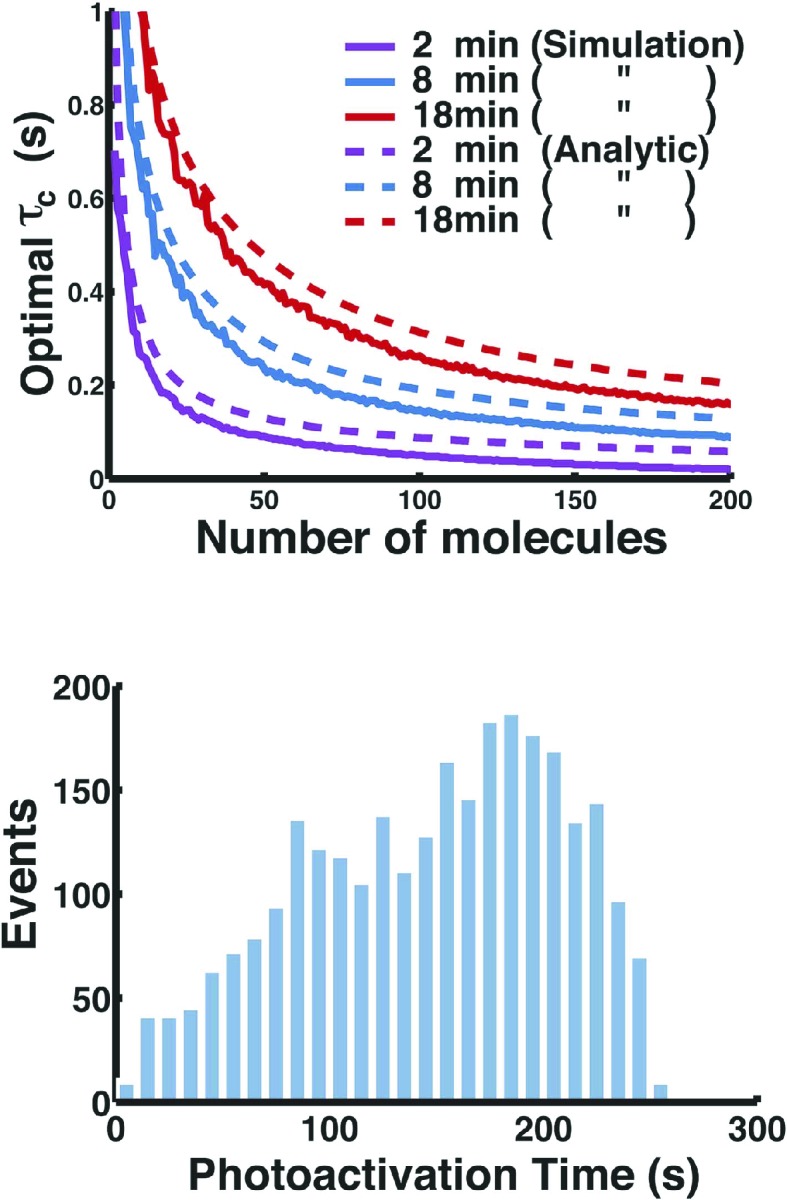
Figure 5—figure supplement 2. Fermi-photoactivation.


