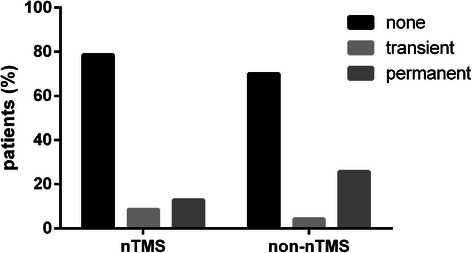
Figure 2.

Surgery-related paresis on long-term follow-up. The graph illustrates the percentage of patients suffering from a transient paresis to the percentage of patients who were diagnosed with a new permanent paresis on long-term follow-up for the nTMS group in comparison to the non-nTMS group (p = 0.1113).
