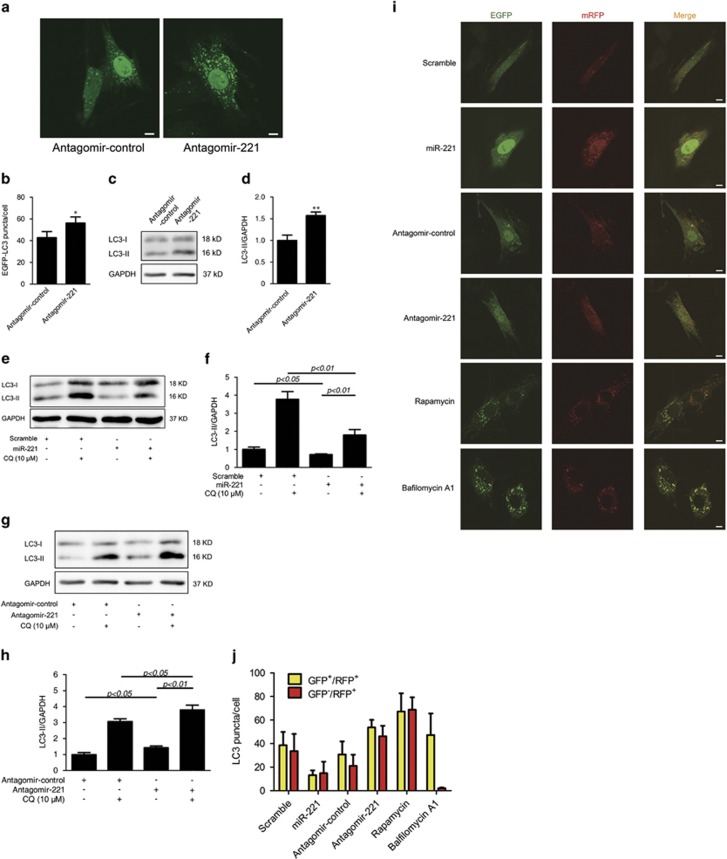
Figure 3.
Knockdown of miR-221 stimulates autophagic flux. Representative images (a) and quantification (b) of EGFP-LC3 puncta (green) in H9c2 cells transfected with miR-221 antagomir or control together with pEGFP-LC3 plasmid. Scale bars: 10 μM. (c and d) Lipidation levels of LC3 in H9c2 cells were transfected with miR-221 antagomir or control antagomir. H9c2 cells were transfected with scramble or miR-221 mimics (e and f) and miR-221 or control antagomir (g and h) in the presence or absence of 10 μM chloroquine (CQ) as indicated. Western blotting was performed to detect the LC3 levels. (i and j) H9c2 cells transiently expressing mRFP-GFP-LC3 were co-transfected with scramble or miR-221 mimics, control or miR-221 antagomir for 48 h, or treated with rapamycin (200 nM) or Balfilomycin A1 (100 nM) for 2 h, as indicated. The cells were visualized by confocal microscopy (i). Scale bars: 10 μM. The number of GFP+/RFP+ (yellow) and GFP−/RFP+ (red) dots per cell were quantified (j). The data were obtained from at least three independent experiments, and the values represent the means±S.D. *P<0.05 and **P<0.01 compared with antagomir control

