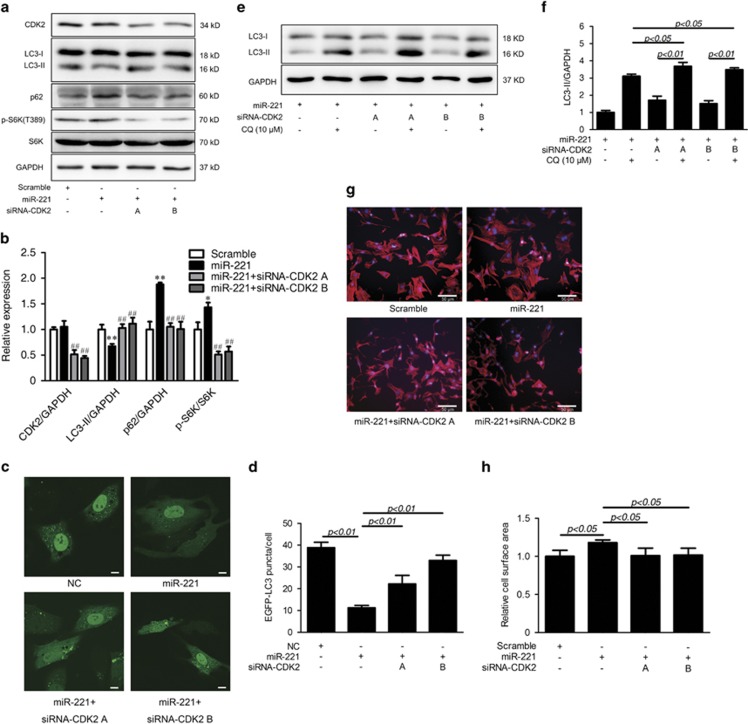
Figure 7.
CDK2 knockdown attenuates miR-221-induced autophagy inhibition and cardiac hypertrophy. (a and b) CDK2 knockdown restored miR-221-induced autophagy inhibition. H9c2 cells transfected as indicated. The phosphorylation status of S6K and levels of LC3-II and p62 are shown (a) and quantified (b). *P<0.01 and **P<0.01 compared with the scramble group and ##P<0.01 compared with the miR-221 group. (c and d) H9c2 cells transiently expressing EGFP-LC3 were co-transfected with miR-221 mimics or scramble together with two siRNAs targeting CDK2, as indicated. Representative images (c) and quantification (d) of EGFP-LC3 puncta (green) are shown. Scale bars: 10 μM. (e, f) CDK2 knockdown re-activated miR-221-induced autophagic flux impairment. Western blotting images depict LC3-I and LC3-II in H9c2 cells treated as indicated (e). Ratios of LC3-II/GAPDH are shown (f). (g and h) CDK2 silencing rescues the cardiomyocyte hypertrophy induced by miR-221 overexpression. Cultured neonatal rat cardiomyocytes were transfected and treated, as indicated. F-actin and the nuclei of cultured neonatal rat cardiomyocytes were stained with Texas Red-phalloidin and DAPI, respectively. Scale bars: 50 μm (g). The cell surface area was quantified with Image Pro-Plus 6.0 (h). All of the data were obtained from at least three independent experiments and the values are expressed as the means±S.D.

