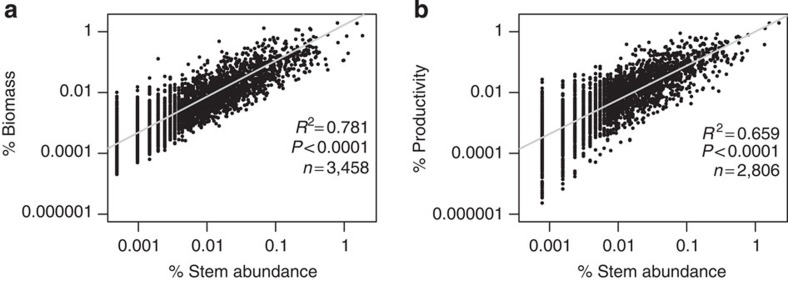
Figure 2. Relationships between species contributions to stem abundance and contributions to biomass and productivity.
% contribution of species to total stem abundance with % contribution to (a) total aboveground biomass and (b) total aboveground woody productivity. Regression models are plotted with grey lines. Regression equation for % contribution to biomass: log(% biomass)=0.22+1.18 log(% stem), regression equation for productivity: log(% productivity)=0.003+1.12 log(% stem). All 530 plots are used for a, and the reduced productivity data set of 221 plots is used for b. 77 species with negative or 0 productivity were excluded from b. Plotted on log scale.

